
Hostwinds Tutorials
Search results for:
Table of Contents
How to Use cPanel's Analog Stats Tool
Tags: cPanel
When it comes to tracking web statistics such as bandwidth or visitors, Hostwinds believes more options are better. We provide you AWStats and Webalizer and provide Analog Stats to help you keep track of all of your metrics.
How Do I Use Analog Stats?
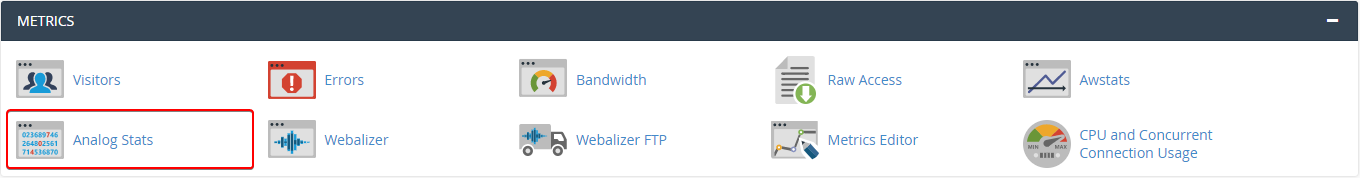
The Analog Stats tool can be found under the Metrics section on your cPanel home page.
Upon clicking on the Analog Stats option, you are greeted with the Analog Stats page. The page lists all of your domains, subdomains, and their SSL equivalents.
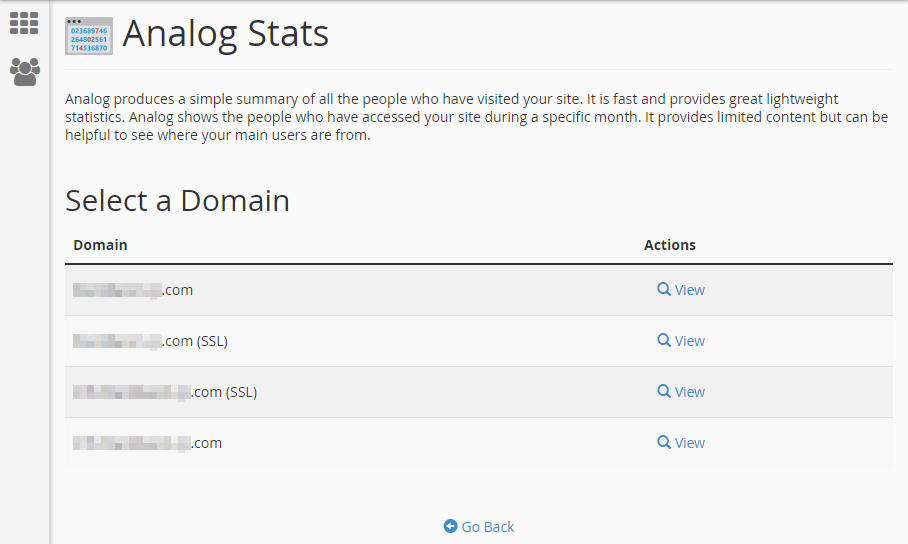
Under the Actions column, you can click on the View option to see the available months of data for the domain in question.
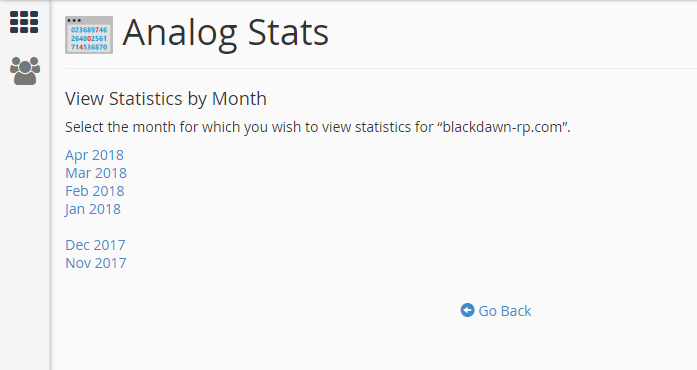
Once you have selected a month to check, you will get the full details Analog Stats reports of your domain for that month.
Analog Stats has very detailed information and can be overwhelming at first glance. Let's look at the major sections of results and break down what is presented.
Analog Stats
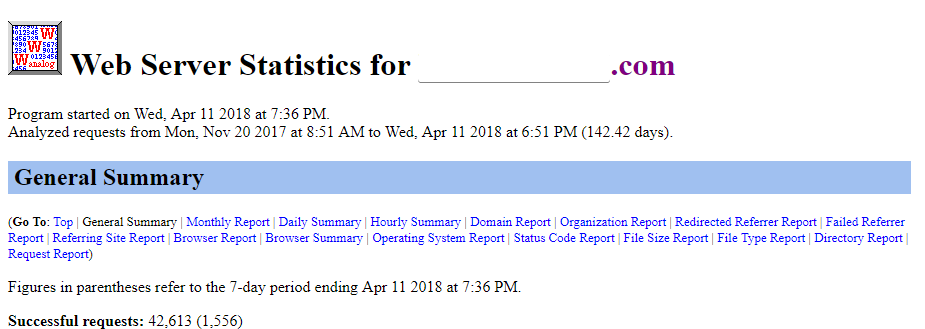
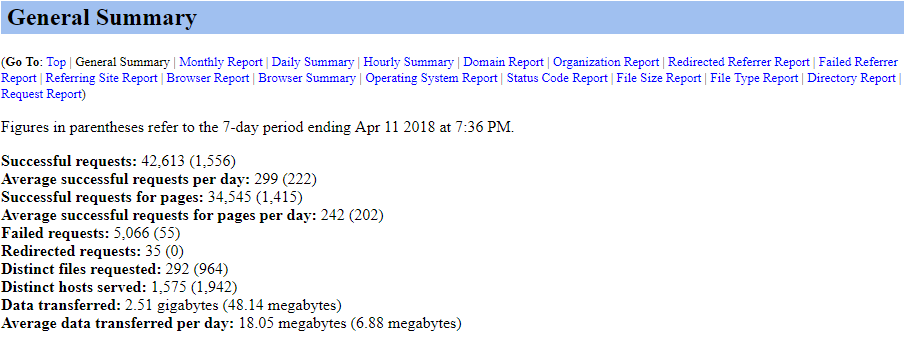
General Summary
At the top of the page is a General Summary of the domain selected during the month chosen.
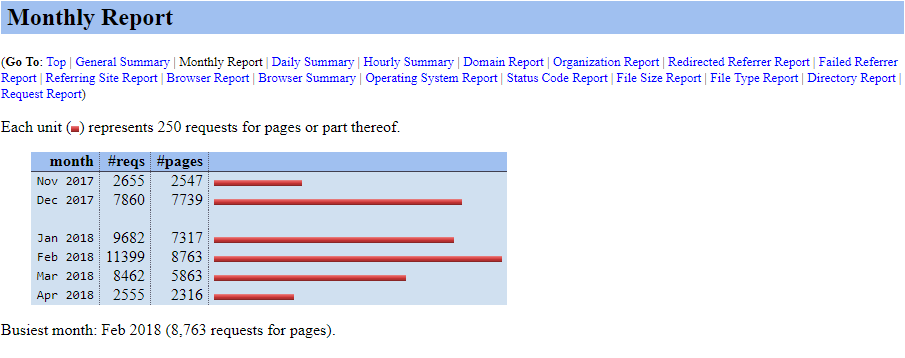
Monthly Report
The Monthly Report is a table and graph indicating the number of page requests for each month your website has been reported for. This can help you track trends in activity and popularity.
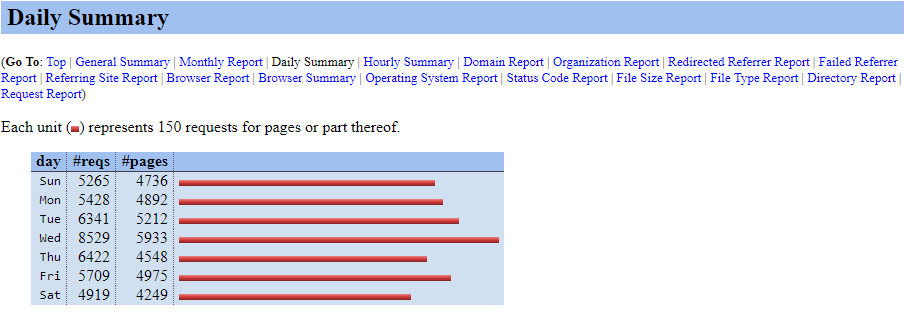
Daily Summary
The Daily Summary is a table and graph representing the cumulative total of page requests made on your website during certain days of the week. This can help you determine which of your days are most popular for your visitors and help you decide when to update content or plan any maintenance.
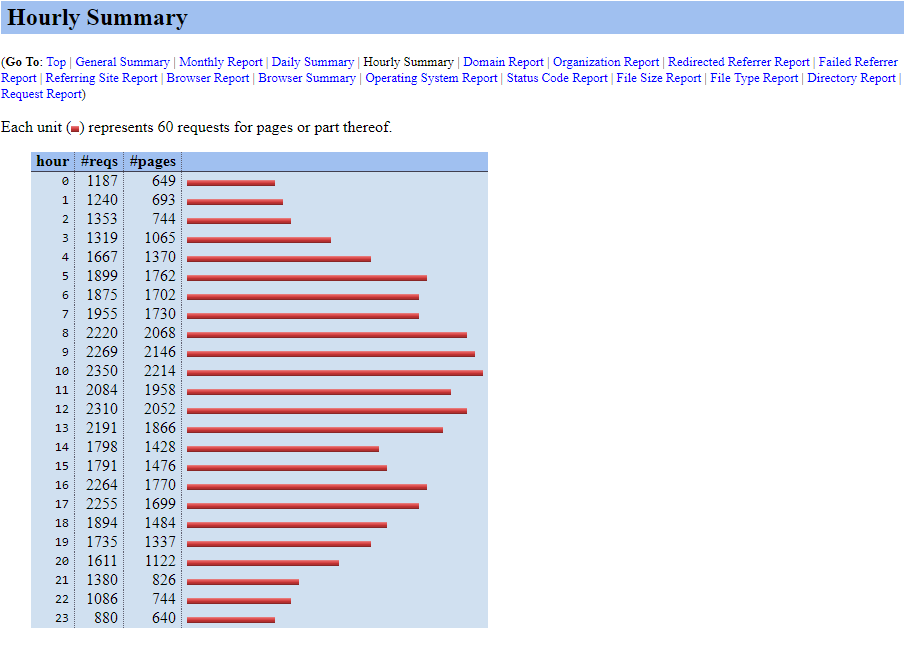
Hourly Summary
The Hourly Summary is a table and graph breaking down the cumulative total of page requests made during certain hours of the day, with Midnight represented as Hour 0. Using this with the Daily Summary can help you determine the best times to do updates or maintenance that might affect the website. You can determine your peak hours and your least active hours to minimize the impact on your website visitors.
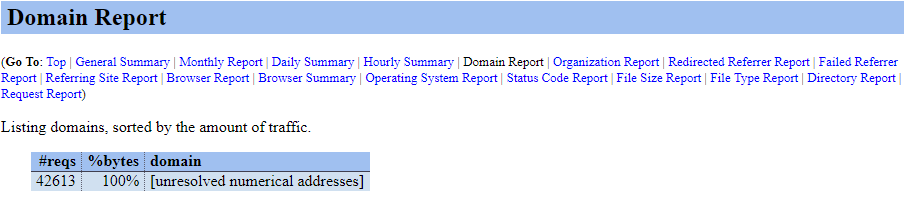
Domain Report
The Domain Report shows how many domains have made requests on your website. Most normal users will not have domains and instead will have unresolved numerical addresses.
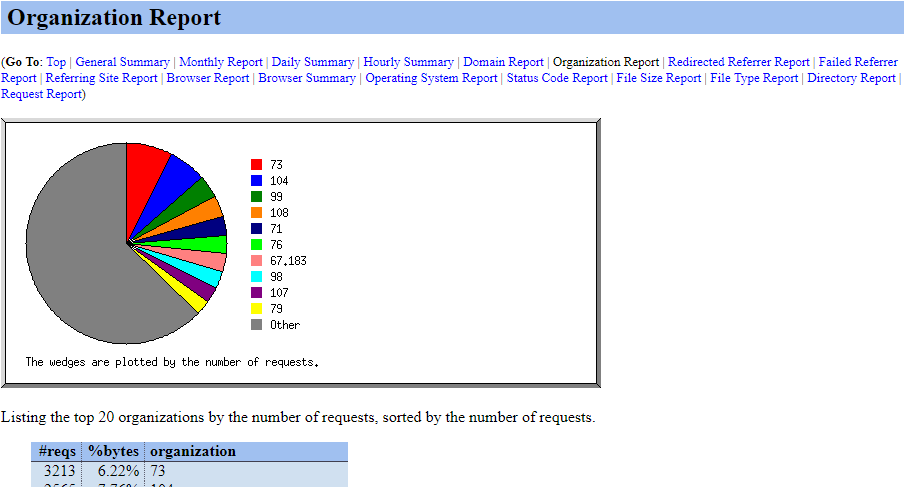
Organization Report
The Organization Report returns the organizations or ISPs from which the computers accessing your website originated.
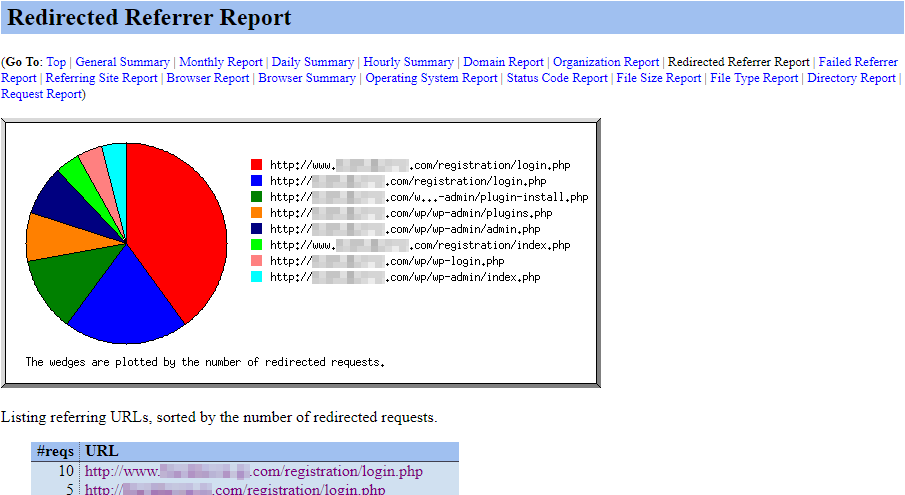
Redirected Referrer Report
The Redirected Referrer Report indicates the web pages and several requests redirecting the user on the website from one page to another successfully.
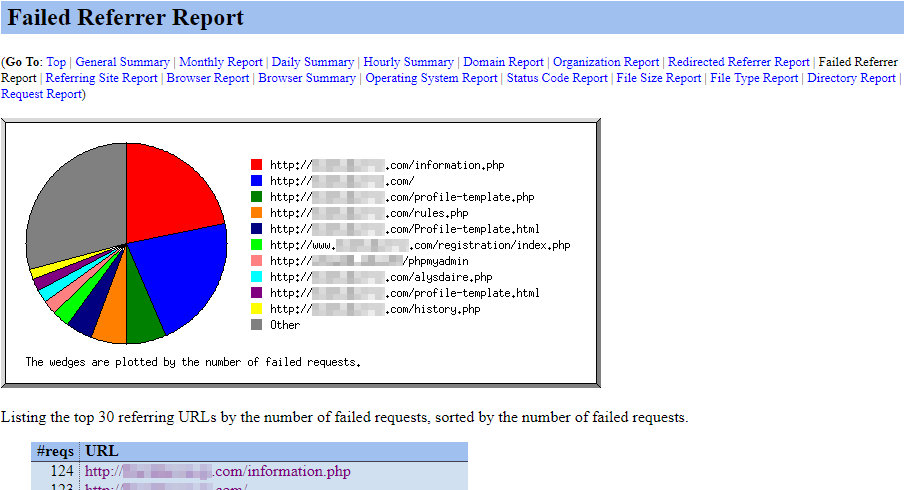
Failed Referrer Report
The Failed Referrer Report indicates the web pages and several requests that have redirected the user on the website to another page unsuccessfully.
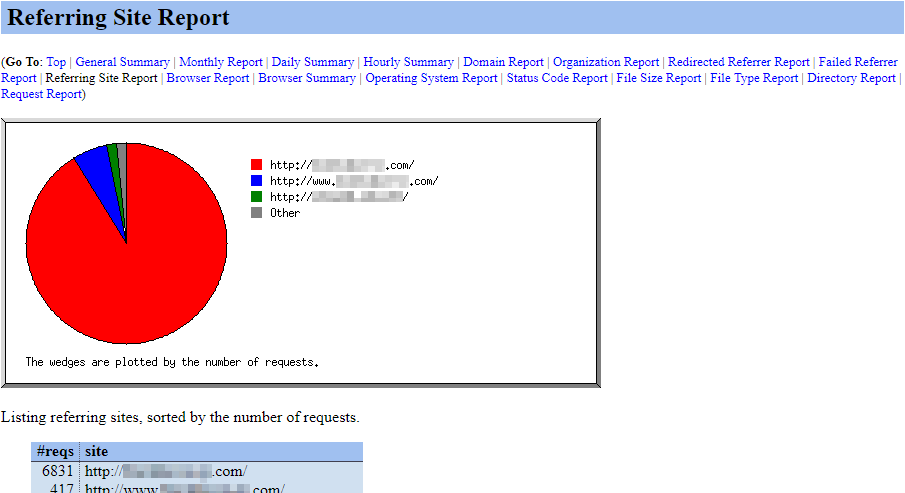
Referring Site Report
The Referring Site Report tells you which website URLs have directed the most visitors to your site. This will include the number of direct referrals, such as when someone goes directly to your site instead of searching for it. This is useful for tracking any referral or affiliate links back to your site or checking on any search engine optimization.
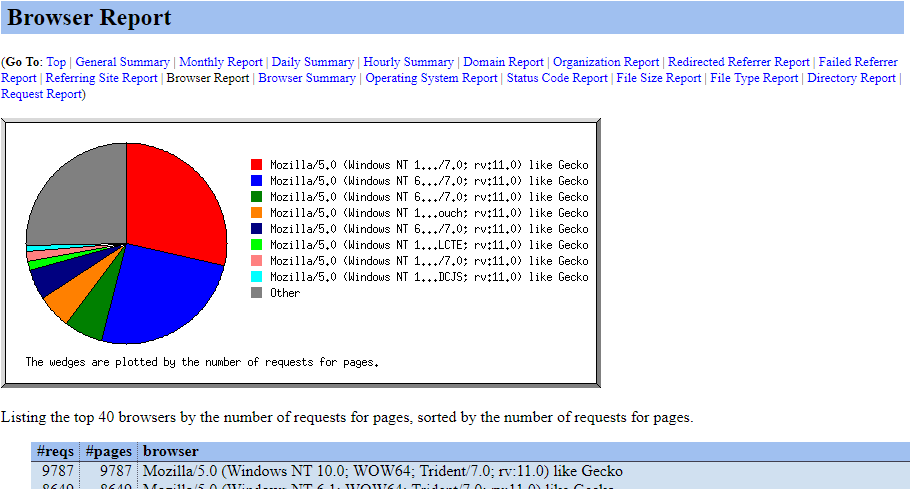
Browser Report
The Browser Report indicates which browsers were most used to visit your website, including the browser version and used plugins. This is particularly useful for website development, as some browsers require additional plugins or coding to have the same features as others.
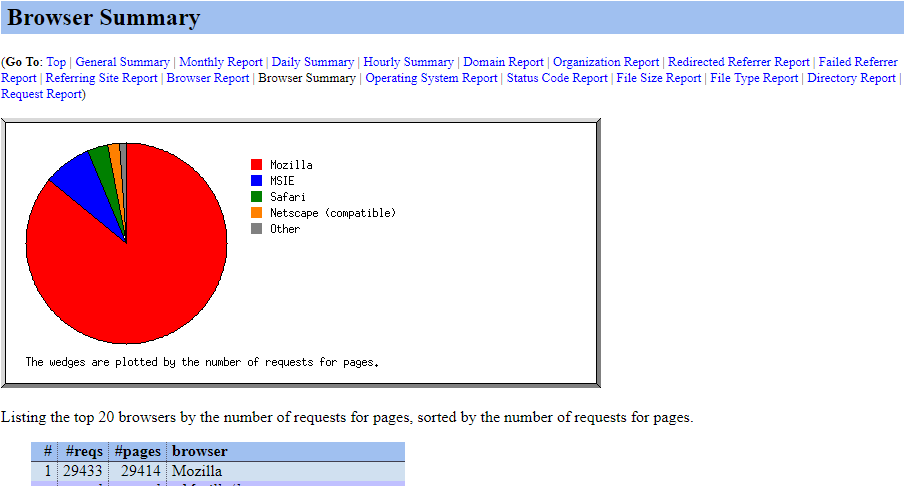
Browser Summary
The Browser Summary gives an overall report on the major browsers used to visit your site. This chart shows all browser versions as one section, rather than breaking them into their own section per browser version.
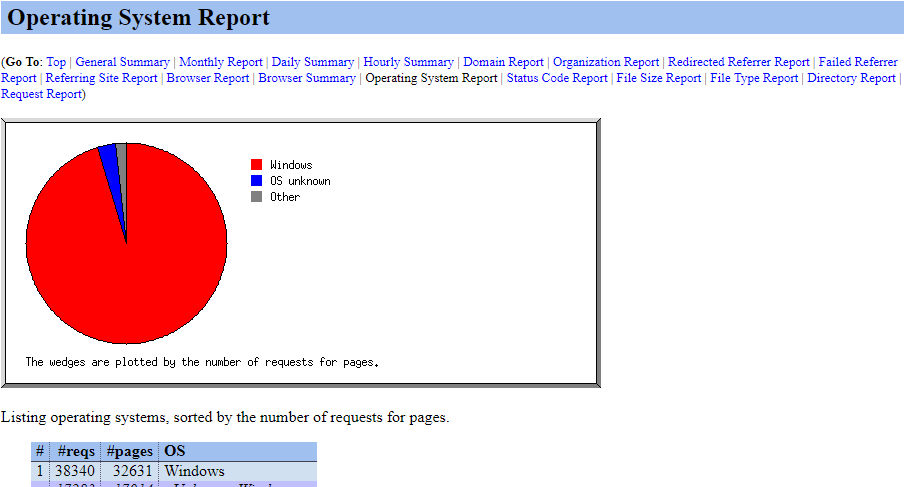
Operating System Report
The Operating System Report details the operating system that was reported by the browser visiting the website.
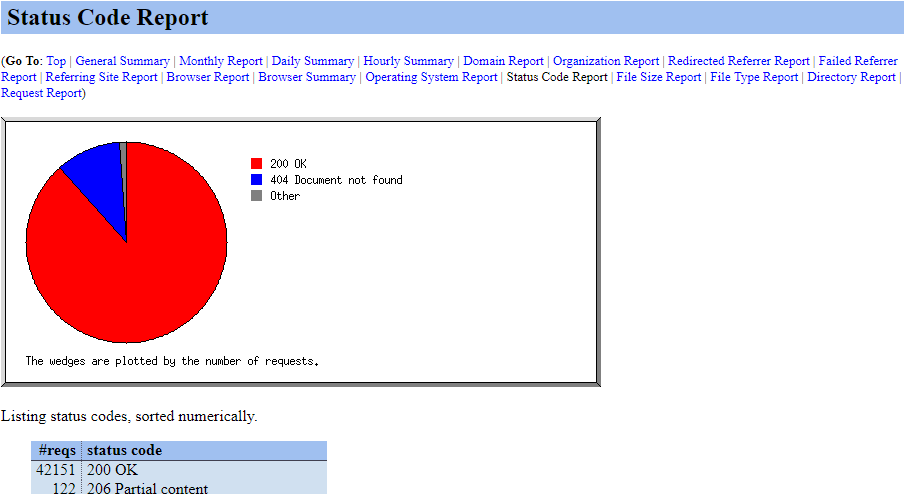
Status Code Report
The Status Code Report details the status of requested files and pages. The most common results are:
- 200 the URL returned a file OK
- 301 the requested URL redirected the user
- 404, the file was not found.
cPanel documentation provides a full list of HTTP Codes and Quick Fixes for review if it is needed.
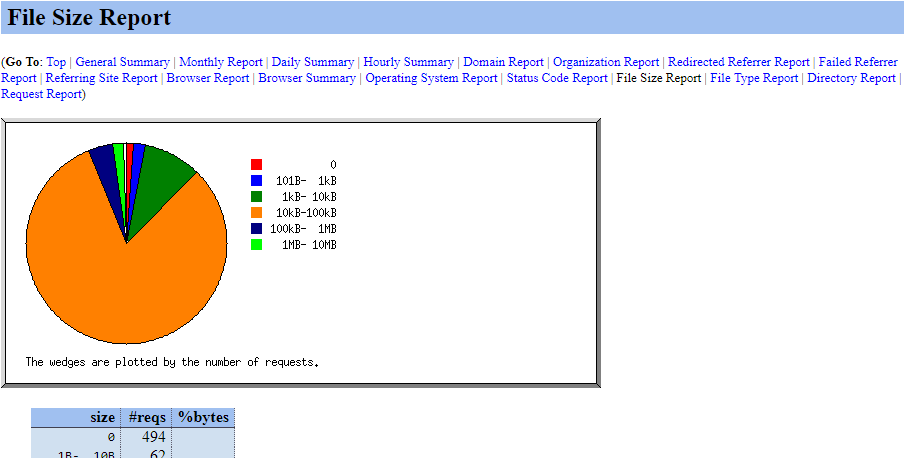
File Size Report
The File Size Report details the size of the files that website visitors request. The larger the files, the slower the site maybe when trying to load a web page due.
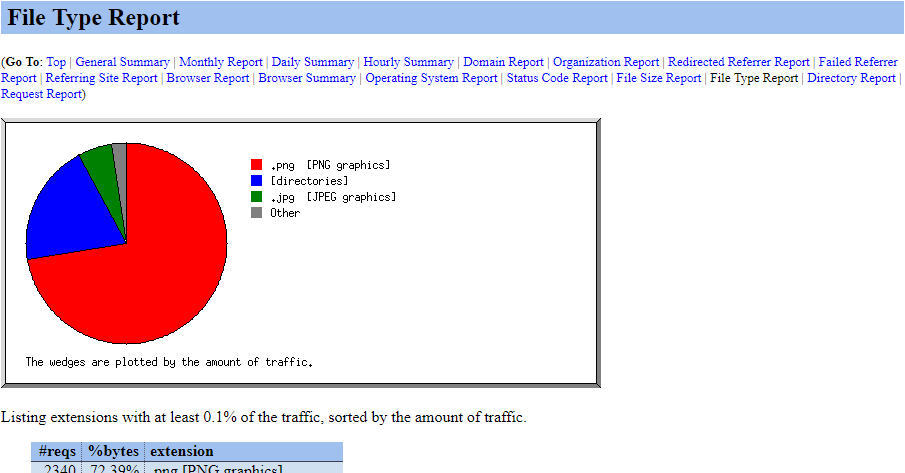
File Type Report
The File Type Report details the file types that are being requested when visitors request your web pages. In this example, a majority of the files were imaged with the. PNG extension file type.
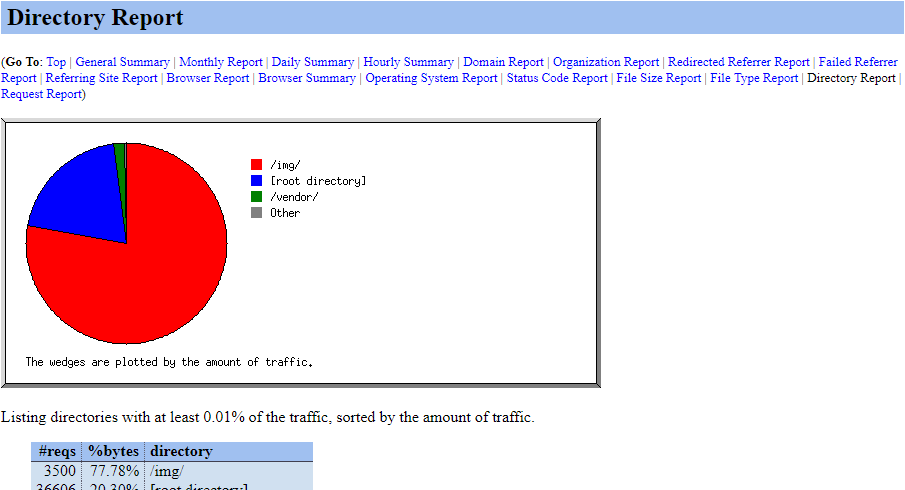
Directory Report
The Directory Report indicates the most frequently requested directories for files from your website. In this example, the /img/ directory is the most requested directory when loading web pages.
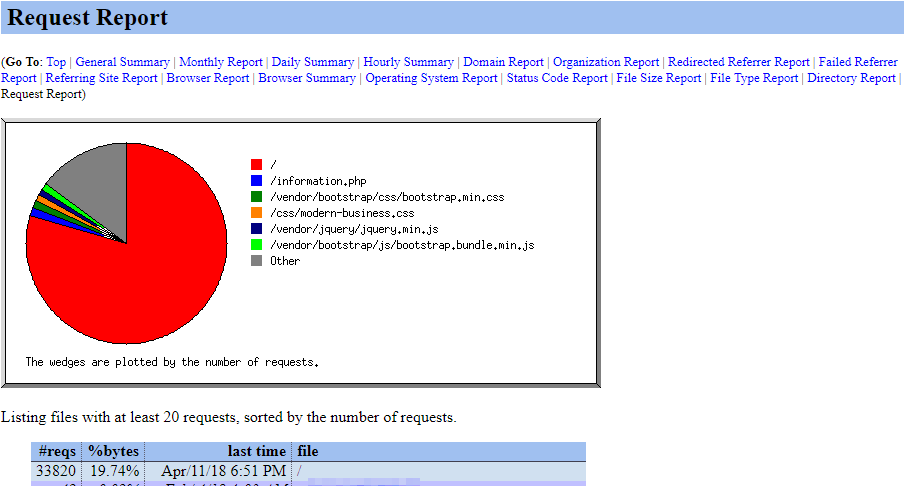
Request Report
The Request Report indicates which pages, files, or directories are most commonly requested for information when visitors come to your website. In this example, the / directory indicates the home page on testdomain.com, while information.php indicates it was on testdomain.com/information.php.
Written by Hostwinds Team / April 18, 2018