
Hostwinds Tutorials
Search results for:
Table of Contents
cPanel AWStats Metrics
Among all of the tools that cPanel offers to track the various metrics of your website, one of the most frequently used and detailed options is AWStats. This tool analyzes server log files and produces HTML reports on your website, presenting various charts and graphs to view information on visitors, visit duration, most viewed pages, and what other websites referred your site to the visitors.
How Do I Use AWStats?
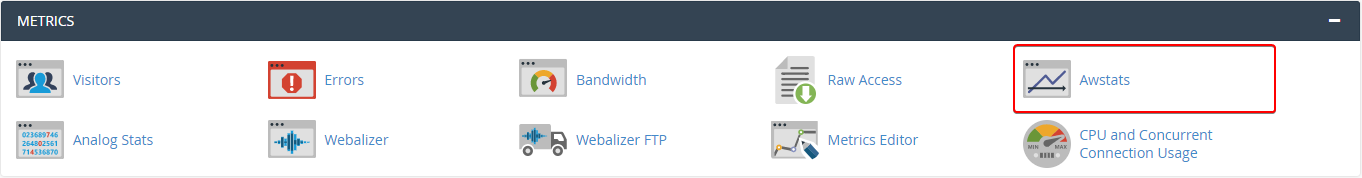
The AWStats tool can be found under the Metrics section on your cPanel home page.
Once you click on the AWStats option, you will be directed to the Awstats page. This page will list all of your cPanel's domains, subdomains, and their SSL equivalents.
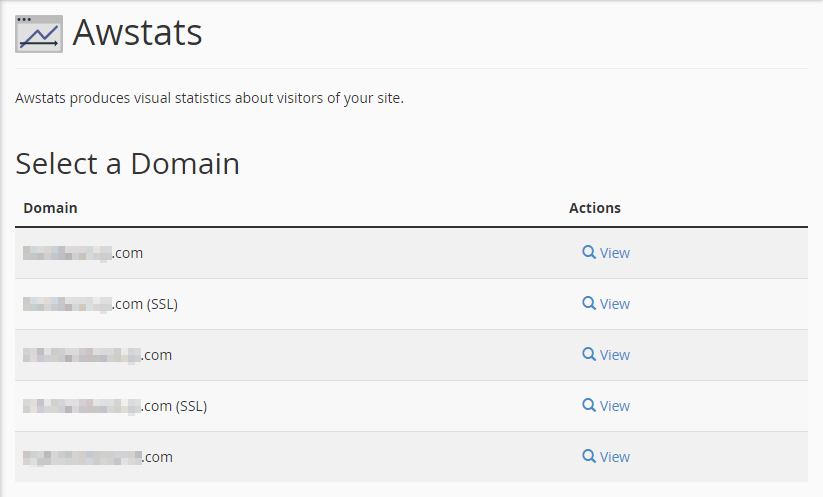
Under the Actions column, you can click on the View option to see the full detailed lists of Awstats for the domain in question.
Awstats has very detailed information, and as such, it can at first be overwhelming. Let's look at the major sections of results and break down what is presented.
Awstats Information
Summary
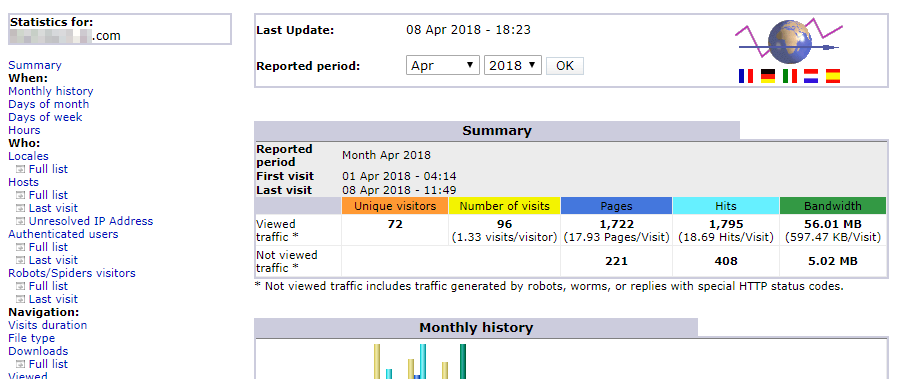
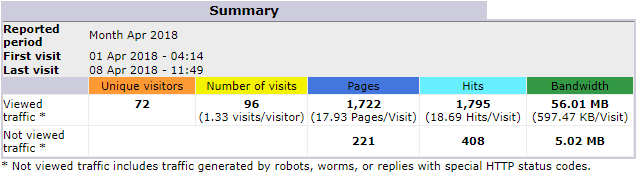
At the very top of the page is a quick summary of important information. It details the following:
- Reported Period
- First and Last Visit to the website
- Orange: Number of unique visitors to the website
- Yellow: Number of total visits to the websites, as well as how many visits per unique visitor on average
- Blue: Number of pages loaded for the visits, as well as how many pages per visit on average
- Cyan: Number of hits (page requests), as well as how many hits per visit on average
- Green: Total bandwidth used, as well as how much bandwidth was used per visit on average.
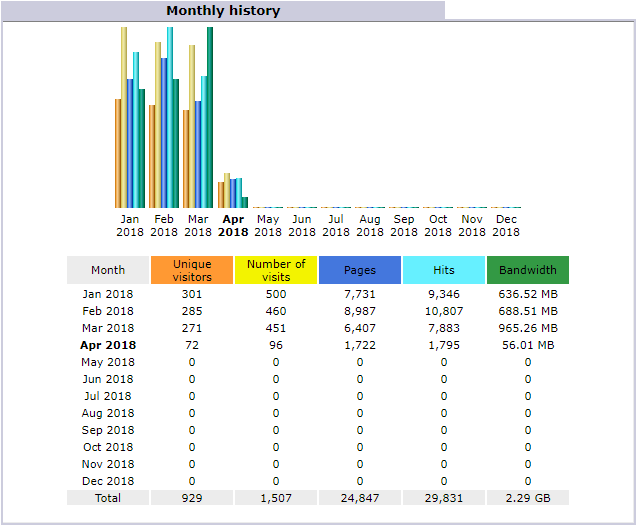
Monthly History
The first graph will detail the reported sections' monthly history for each month of the current calendar year. This allows you to track large trends over the current calendar year, letting you know of any major shifts in your monthly visitors to major updates or major additions or subtractions from your site. The graph details for each month:
- Orange: Total unique visitors for the month
- Yellow: Total visits for the month
- Blue: Total pages for the month
- Cyan: Total hits (page requests) for the month
- Green: Total bandwidth for the month
At the bottom, the table also provides a total overview of the year-to-date aggregate for all five of these tracked statistics.
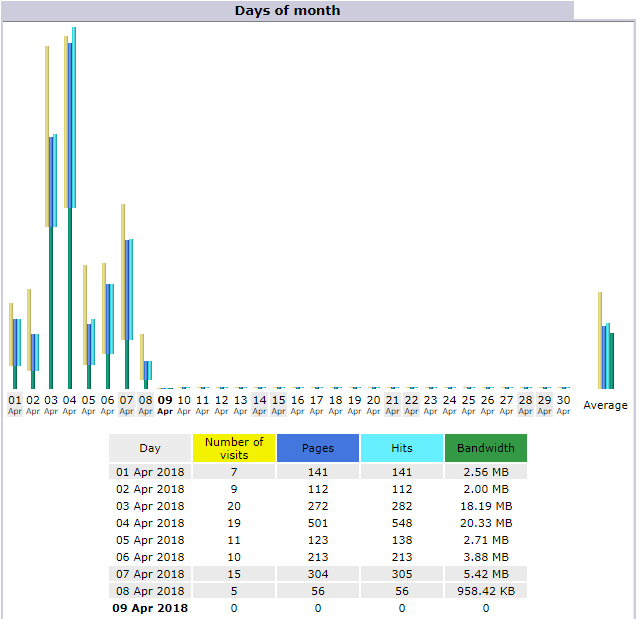
Days of Month
The Days of Month graph indicates the traffic recorded on the days of the selected month at the top of the page in the summary. This allows you to track daily trends, seeing the traffic of your visitors for every day of the reported month. With this, you can tell if there are major spikes or lulls in your traffic based on new content or certain days of the week. In this example, we have it set for April of 2018. As you can see, it details each day's record of the following:
- Yellow: Number of visits
- Blue: Number of pages
- Cyan: Number of hits (page requests)
- Green: Amount of bandwidth used
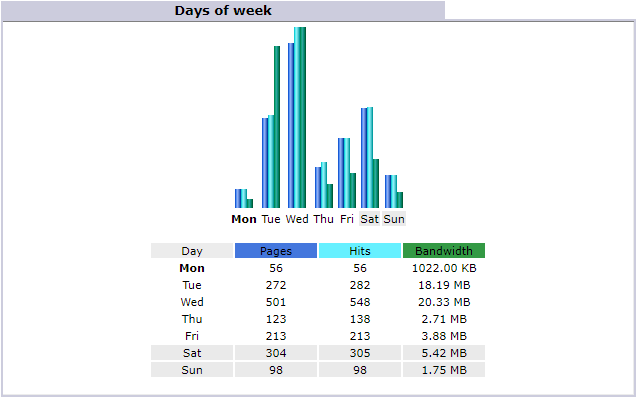
Days of Week
The Days of Week record shows the aggregate amount of traffic accumulated on certain days of the week. This can be very useful in helping determine which are your peak days for visitors, which can help influence when you should upload new content or do any maintenance that may cause site downtime. In this example, since Sunday and Monday are the least-visited days, it would make the most sense to take the site down for maintenance or updates on these two days. This graph charts the following:
- Blue: Number of pages
- Cyan: Number of hits (page requests)
- Green: Amount of bandwidth used
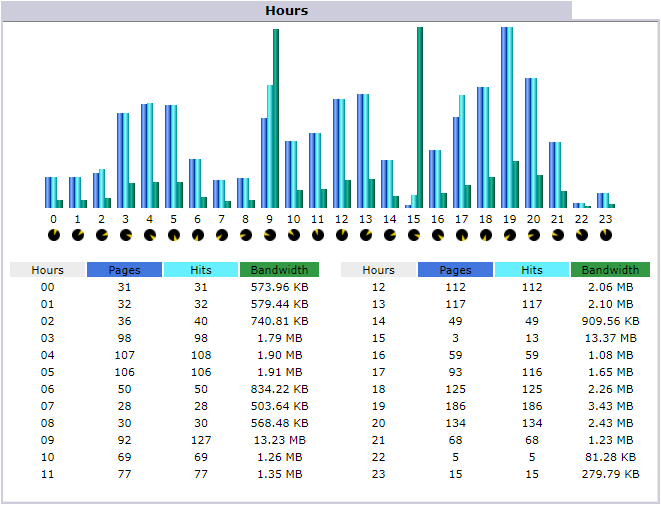
Hours
The Hours graph details the total amount of pages, hits, and bandwidth used during certain hours of the day. The hours start from midnight at 00, with hour 23 being 11 PM server time. This tool can help you determine when your peak hours are so that if you ever need to perform updates or take the site down for maintenance, you know when the fewest visitors will be affected. According to our example, the slowest hours for visitors are 10 PM (Hour 22) to 3 AM (Hour 03), with similar lulls between 6 AM (Hour 06) and 8 AM (Hour 08), and at 3 PM (Hour 15). The graph records the following:
- Blue: Number of pages
- Cyan: Number of hits (page requests)
- Green: Amount of bandwidth used
Who Visited My Site?
The Locales section has several metrics to view in great detail regarding who visited your website and from where. The most useful graphs in this section are the Top 25 Locales, the Top 25 Hosts, and the Top 25 Robots/Spiders.
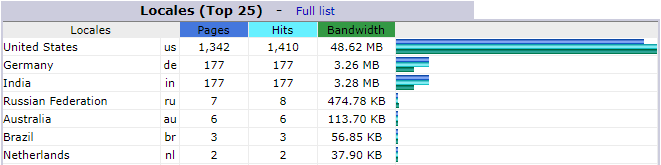
Locales
The Top 25 Locales graph shows the top 25 locations that visitors to your site originated during the reported month. This can help you determine where your strongest audience is and whether you need to tailor your site's content or ads towards new locales. The following is recorded:
- The locale that visited the site
- Blue: Number of pages
- Cyan: Number of hits (page requests)
- Green: Amount of bandwidth used
- A bar graph comparing the number of pages, hits, and bandwidth
If you wish, there is a full list of all Locales available rather than the Top 25. Click on the Full List link next to the Locales (Top 25) title to see the full list.
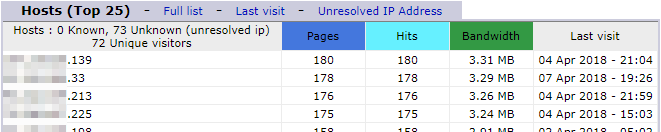
Hosts
The Hosts graphs will detail the Top 25 Unique visitors to your website during the reported month. This table reports on the unique visitors that have arrived on your website, including the following records:
- The host IP address of the unique visitor
- Blue: Number of pages
- Cyan: Number of hits (page requests)
- Green: Amount of bandwidth used
- The timestamp of when this visitor last visited your site
If you wish, there are links in the table title that include seeing a Full list of all recorded visitors, as well as sorting visitors by the latest visitor under the Last visit link, and an option to show only visitors who have unresolved IP addresses.
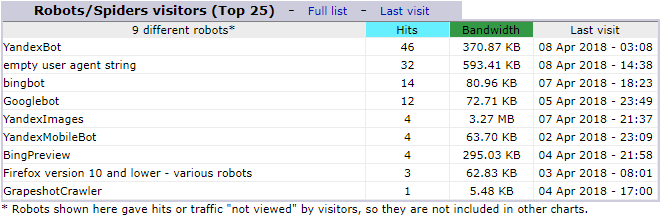
Robots/Spiders
This section details all of the robots, spiders, and crawlers that have accessed your website. Robots, also known as spiders or crawlers, are programs that search engines use to explore the web, collecting and downloading all of the web content available on websites they come across.
They capture all of the text and links, updating the search engines as to the available pages and sites that it can search for. Knowing which bots are checking your site allows you to customize or prioritize your search engine optimization towards those bots and their associated search engines.
Search Engine Optimization (SEO) is a key to increasing your traffic and getting your website to appear higher on the search engines. The higher your search engine ranking, the more visitors you will attract, and the more revenue you will generate either for your business or ad revenue.
What Pages Did My Visitors Visit?
While it is important to know who visited your site and when it's also just as important to know what pages they visited and how, Awstats provides detailed data on what pages your visitors first came to on your website, what pages they left on, and how long they stayed. This lets you know what parts of your site are working and which are not.
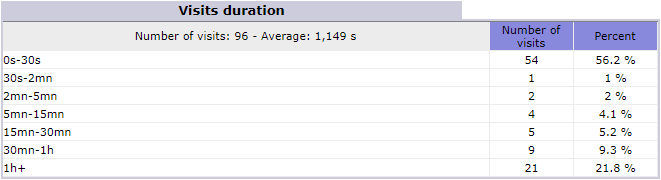
Visits Duration
The Visits Duration table shows you how long your visitors have spent on your website. It breaks down the information into intervals, with the top interval being how many visitors stayed for less than 30 seconds.
You can use this metric to determine how well your website's information is catching your visitors. If they aren't sticking around for a long time, you can try to make changes more welcoming or enticing for new visitors.
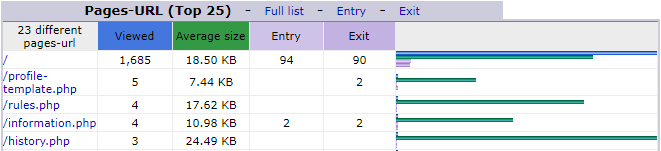
Viewed Pages
The Pages-URL table shows you the top Viewed Pages on your website. This can help you determine which sites need the most optimization or updates more often to retain your visitors. The table also allows you to see the full list of all of your web pages and their visitors, as well as to sort by which pages are the first viewed (entry) or last viewed (exit) on your site.
The table records:
- The URL of the webpage
- How many times the page was viewed
- The average size of the page requests response
- How many times the page was used as the entry page
- How many times the page was used as the exit page
- A bar graph that details the viewed, average size, entry, and exit data in comparison
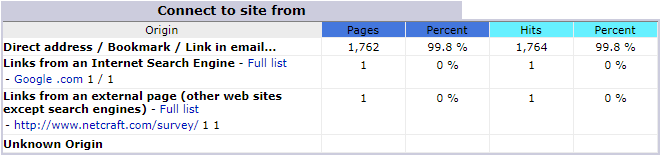
Referrers Origin
The Connect to Site From table shows you all of the referrers and their origin that referred to your website. This is where you can review how well your SEO is working, for instance, and how many people are arriving on other links.
In this example, we can see that 99.8% of the users arrive by going to the domain directly, while 1 person visited through the Google.com Search Engine, and 1 person arrived from a third-party website.
This is especially useful if you have any trade deals, advertisements, or affiliate links on other websites, as you can see how much traffic those sites, advertisements, and affiliates are generating to your website and business.
Written by Hostwinds Team / April 10, 2018