
Hostwinds Tutorials
Search results for:
Table of Contents
cPanel Bandwidth Metrics
Tags: cPanel
cPanel provides several ways to measure your websites. The Bandwidth metric is a tool for viewing your website's overall bandwidth usage for your traffic. This is very useful, particularly if you need to upgrade or review your websites' resources to determine if you will need additional bandwidth on your services.
How Can I Track My Site Bandwidth?
The Bandwidth tracker is located under the Metrics section on your cPanel home page.
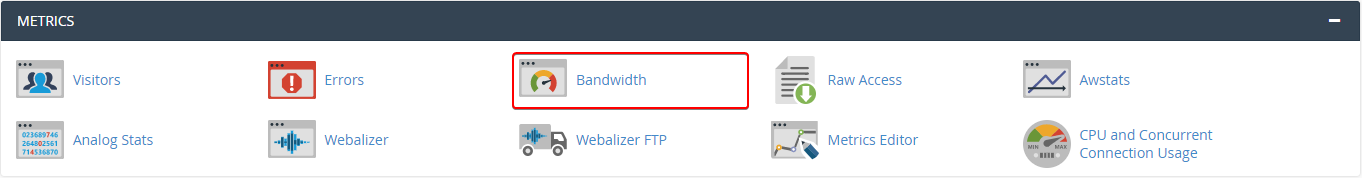
When you click on the Bandwidth icon, you will be redirected to the Bandwidth page. This page will show multiple graphs and periods of data relating to the bandwidth usage for your cPanel service. This includes HTTP requests, email requests (IMAP, POP3, SMTP), and FTP requests.
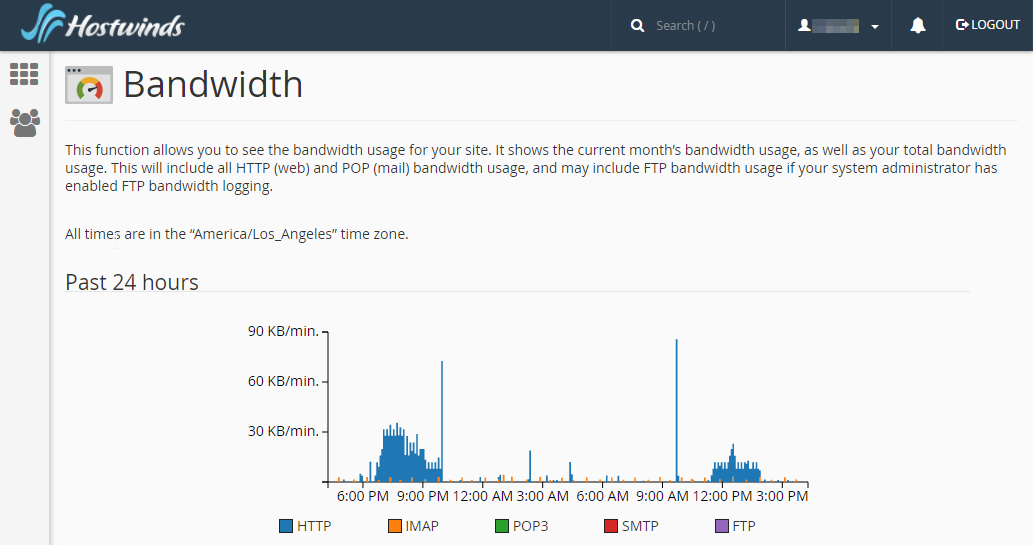
By default, the Bandwidth tracker will not record server-side services, such as the cPanel File Manager's uploads and downloads, incoming mail that other servers deliver, DNS activity, POP/IMAP bytes received for tasks such as polling for new email, or any processes spawned by cron jobs that perform network activity.
Breaking Down the Graph Data
The first three graphs will detail the total bandwidth used in the past 24 hours, the past week, and the past year. For all three of these graphs, there are five categories of bandwidth data:
- HTTP: Website traffic.
- POP3: Email that your website's accounts have received
- IMAP: Email that your website's accounts have received
- SMTP: Email that your website's accounts have sent out
- FTP: File transfers to and from the site
You can clearly see all five of the categories with their respective graph colors underneath the graph for each graph. By default, the graphs update every two hours.
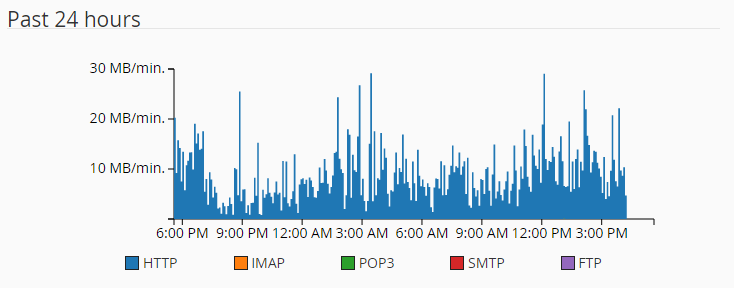
Past 24 Hours
This graph details all of the bandwidth used in the past 24 hours for all your sites on the cPanel account. The data is in bits per second, averaged into five-minute intervals.
This chart can help you determine small-scale trends for traffic during the day, helping you determine when your site is most viewed and when it is least viewed. This can be very helpful in determining when to perform updates or maintenance, as well as when to post new content for the day before your peak visitor hours.
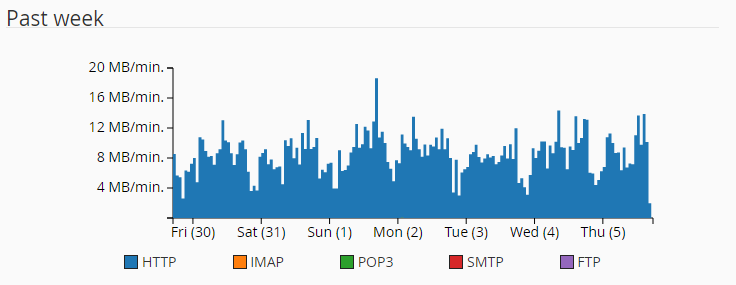
Past Week
This graph details the bandwidth used in the past seven days for all your sites on the cPanel account. The data is in bits per second, averaged into five-minute intervals.
This chart is better for determining larger trends for view, such as if you have gotten traffic spikes at the same time of day three days a week. You can also use this to see if there are changes in your traffic from day to day based on any content updates or other changes you have made to the site. This can help you determine if a new site layout is causing increased or decreased traffic or if new content posted may have increased the popularity of your site.
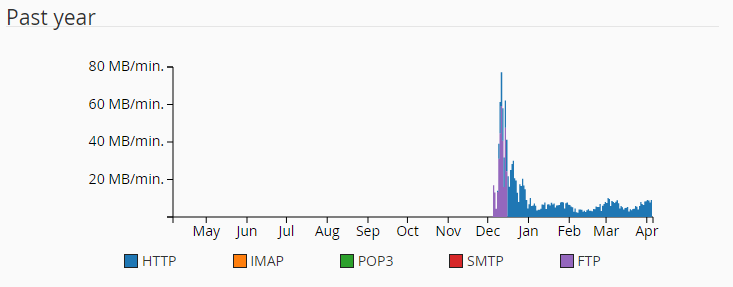
Past Year
This graph details the bandwidth used over the past year for all your sites on the cPanel account. The data is presented in bits per second.
The graph can help you track your long-term trends for your site, such as if there are more visitors during the start of the month every month or if a major change to the website's content had any long-term or adverse effects compared to previous timetables.
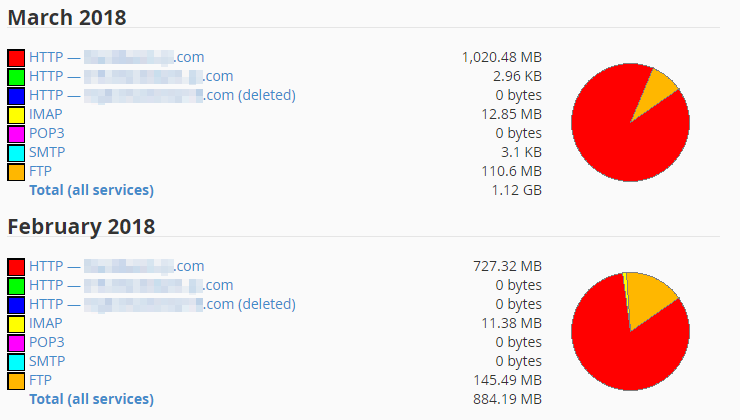
Monthly Pie Charts
The pie charts show the percentages of bandwidth used for each of the services for the month listed out of the total used. You can use this tool to track the total amount of data used each month and which services use how much of the bandwidth is recorded. This is especially useful if you have multiple sites, as you can track which of your sites are pulling more traffic.
For instance, in the example we provide, the blue and green HTTP domains had received no traffic in February 2018, but in March 2018, the green domain received 2.96 KB of bandwidth from visitors. Likewise, in February 2018, there was no SMTP bandwidth traffic, indicating none of the domains sent any emails off the server. In March 2018, there's 3.1 KB of bandwidth, indicating emails were being sent out.
Service Bandwidth by Day
If you click on the name of the service listed in the Monthly Pie Charts, you will get a detailed day-by-day review of the bandwidth attributed to the service in question. For example, if we click on the red domain's name HTTP – reddomain.com, we will get a detailed breakdown of each day's HTTP bandwidth usage for March 2018.
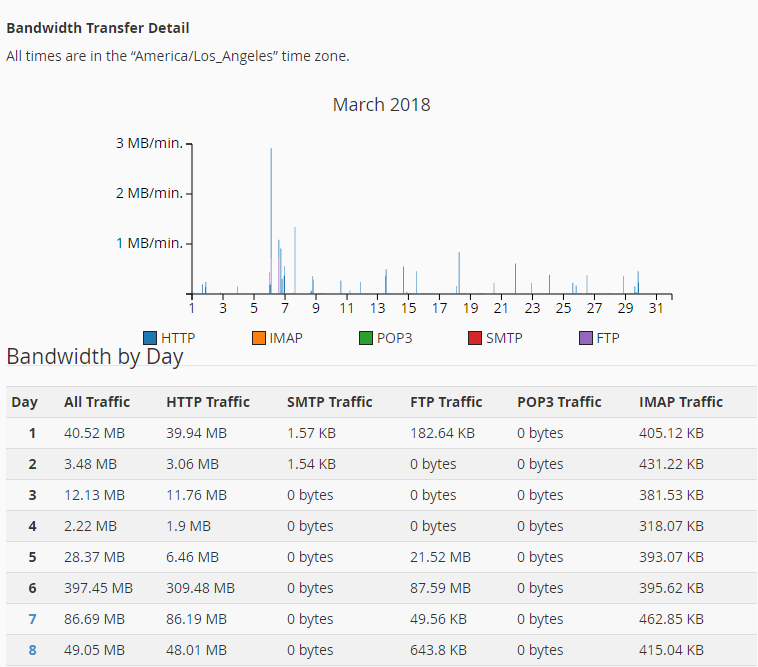
Total Bandwidth by Day
You can also click on the pie chart or the total at the bottom of each month to get a day-by-day recount of all services side by side for each day of that month.
Written by Hostwinds Team / April 13, 2018