
Hostwinds Tutorials
Search results for:
Table of Contents
cPanel Errors Metrics
cPanel contains a way to keep track of the most recent errors logged regarding your website. The Errors section details these error messages for you quickly and easily without needing to dig through the other metrics options for the desired information.
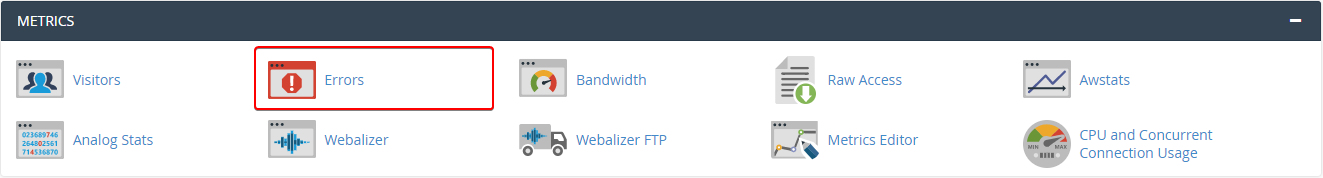
How Can I Track My Website Errors?
The Errors logger is located under the Metrics option on the cPanel home page for your website.
Once you click on the Errors logger, you will open cPanel's page that details the last 300 errors that have occurred by visitors to your website. You can use this tool to determine if there are broken links or missing files on your website.
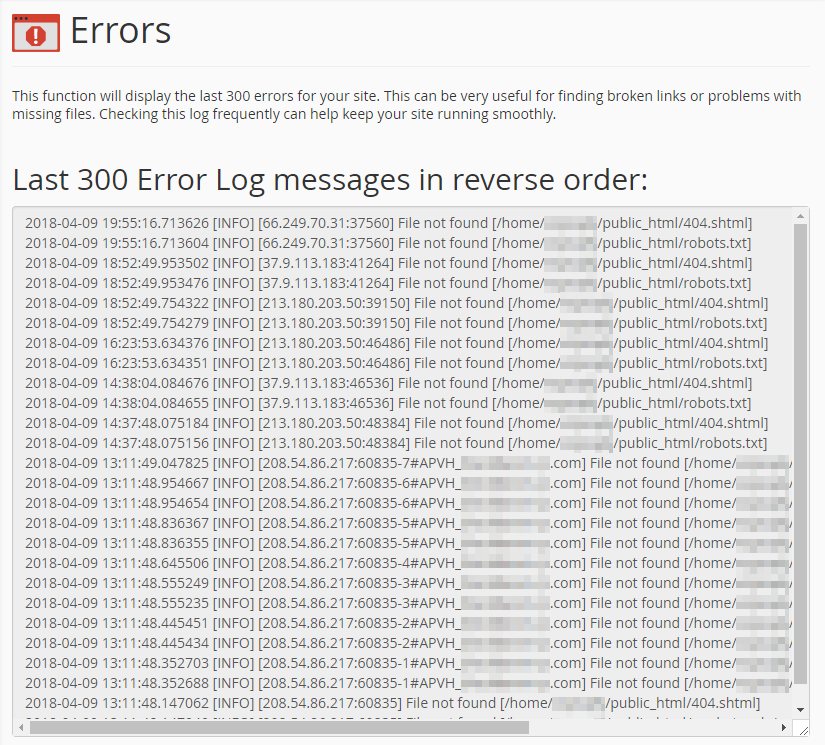
How Do I Read My Error Log?
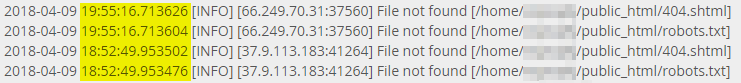
The data looks confusing at first but can be easily broken down. Let's use the latest 4 errors to explain what is being shown.
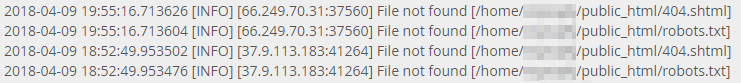
Date
The date of the error is detailed at the start of the error log. In our example, all four of these errors occurred on April 9th, 2018.
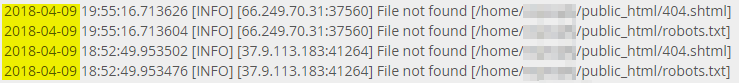
Time
The time of the error comes next. In our example, the latest error, located at the very top, indicates that the error occurred at 19:55:16.713626. This translates to 7:55 PM server time, at exactly 16.713626 seconds. All-time presented is in a 24-hour format, so there is no confusion between AM and PM.
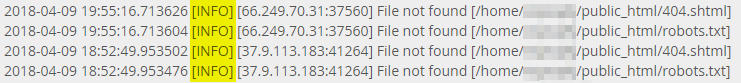
Log Type
The log type indicates what type of log was recorded. In this case, the log is an INFO log, which means the server continued functioning as normal, and the information of the error is provided here for review.
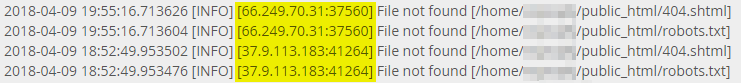
Client
This is the IP address that made the request of your website that created the error. This is essentially the visitor trying to access the web page that caused the error in the first place. The latest error for our example was caused by the host 66.249.70.31 using port 37560.
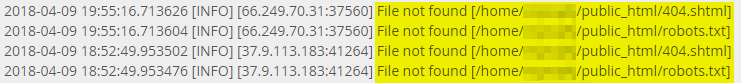
Error Message
This is the error message itself that was generated from the client request. In our example, a File not found error was generated because the user looked for the file "404.shtml" or the file "robots.txt" and found neither one of them in the "public_html" directory.
Written by Hostwinds Team / April 10, 2018