
Hostwinds Tutorials
Search results for:
In this guide, we will be going into the step-by-step installation process for Grafana on a Debian or Ubuntu Linux Distribution. All you would need for this guide is access to your Hostwinds server with either distribution. If you have everything and can connect to your Hostwinds Server, then let's start installing Grafana.
To start the installation process, you will need to install 2 protocols on your server. The first, apt-transport-https, will allow you to download repositories accessed from the HTTPS protocol. The second you will have to install is software-properties-common. This will help you manage the repositories that you install packages from. Enter these two commands:
sudo apt-get install apt-transport-https software-properties-common
Next, you will need to add the trusted repository key from https://packages.grafana.com/gpg.key. You would need to enter this command:
wget -O - https://packages.grafana.com/gpg.key | sudo apt-key add -
The next thing you will have to do is add the repository. There will be two different repositories you can add, the normal OSS version and the enterprise version. These two services would essentially be the same, but you can easily upgrade the enterprise version later if you wanted to pay for the service. Here are the commands to enter:
Enterprise:
sudo add-apt-repository "deb https://packages.grafana.com/enterprise/deb stable main"
OSS:
sudo add-apt-repository "deb https://packages.grafana.com/oss/deb stable main"
There are only two simple commands to finish it off. You will need to run an update to get the latest repository from Grafana, and then you will need to install Grafana to your VPS. Also, you will have to install for either the enterprise or the OSS version.
sudo apt-get update
Enterprise:
sudo apt-get install grafana-enterprise
OSS:
sudo apt-get install grafana
Now you should have Grafana installed on your server. Congrats! Now you need to start Grafana to run the application. This is just a simple command that you will need to use to run Grafana.
sudo /bin/systemctl start grafana-server
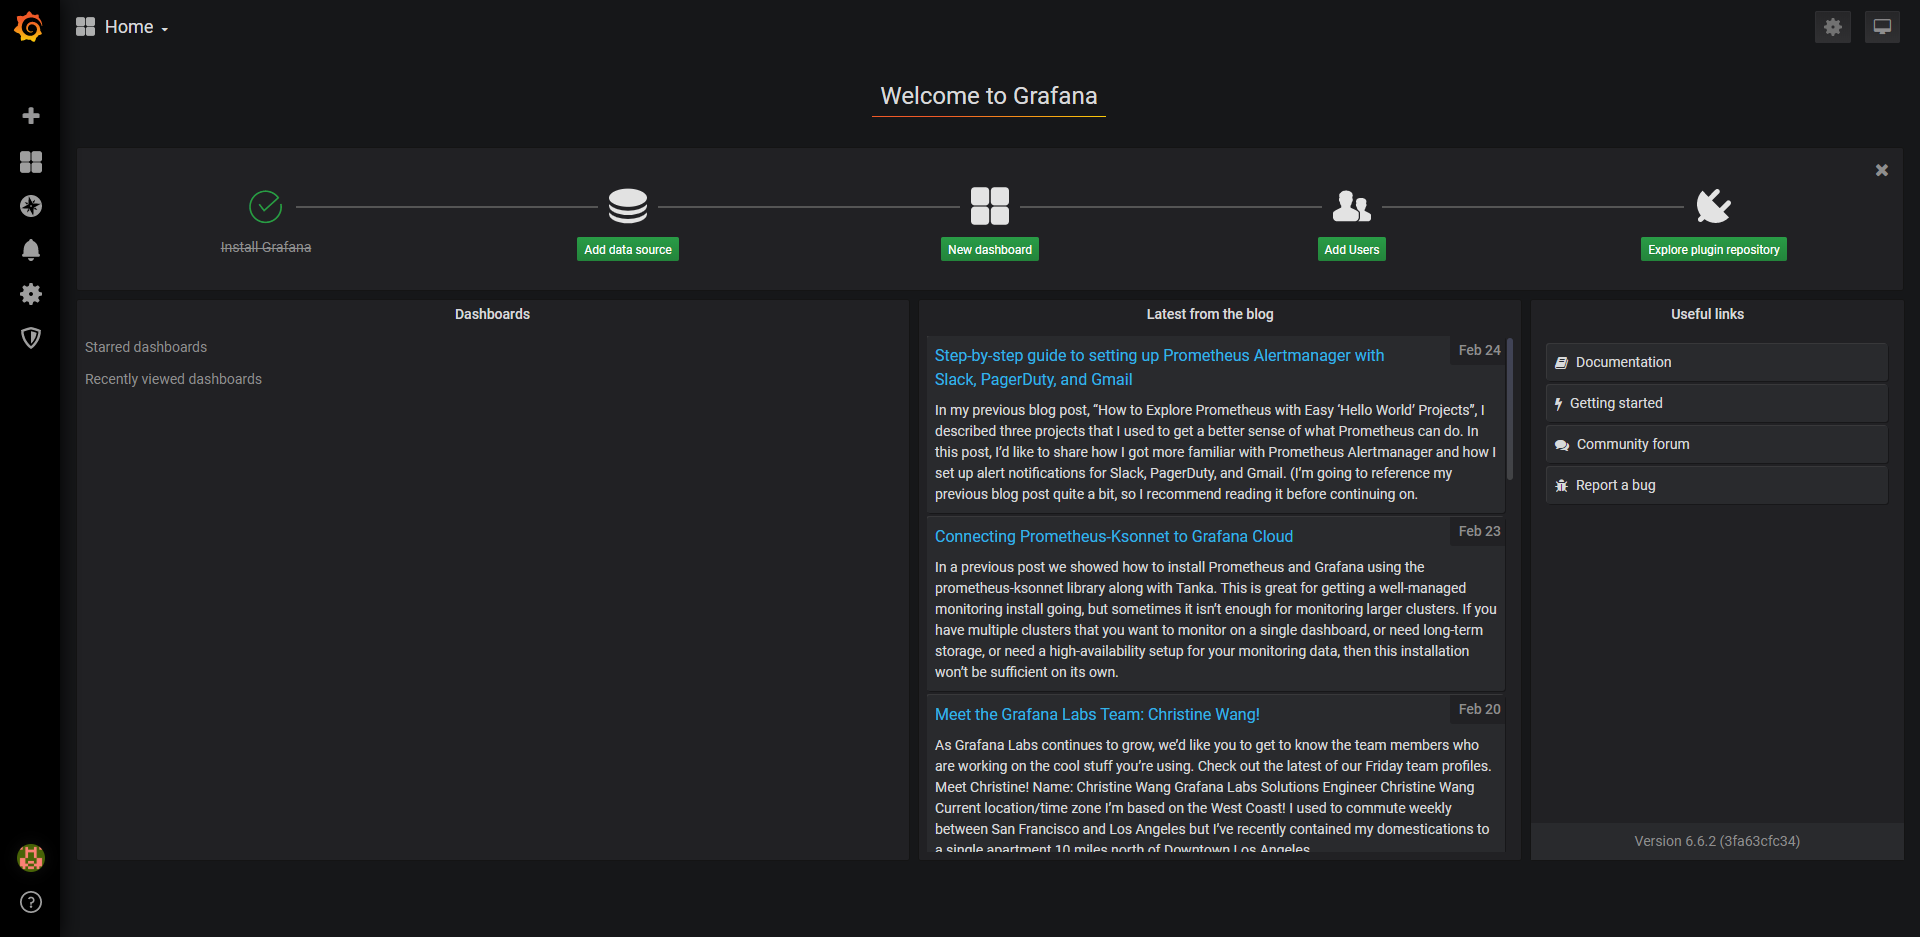
Now that Grafana is running, all you need to do is access it. For this, you will need to go to your favorite browser and enter your IP with port 3000. An example of this would be "yourIP:3000" or " 192.168.1.2:3000". Once you enter that, you should see this screen:

Once you get to this screen, you will want to enter the username as "admin" and the password as "admin" as well. When you have entered this information, it will ask you to change your password.

Lastly, once you enter that new password or skip that process to keep the same password, you will be able to enter your Grafana application.
Written by Luke Johnston / May 29, 2020