
Hostwinds Tutorials
Search results for:
Table of Contents
How to setup Bandwidth monitoring with vnstat (Cloud VPS)
Why use vnstat?
Have you ever had bandwidth overage fees or had a compromised system and found high bandwidth usage and wonder where all the bandwidth went? Bandwidth usage tracking can avoid both issues or help catch usage problem before it gets out of hand (expensive).
There is a Cloud Control bandwidth monitor that you can consult, but it requires logging into your cloud control portal and your specific instance. vnstat, on the other hand, is local to your Server, and when combined with other tools like msmtp, can send periodic text or visual usage updates to your email to take the hassle out of monitoring your resource usage.
Another great feature is that it has low resource usage and, most importantly, does not generate its own traffic other than outgoing updates that you can control. It also stores long-term usage data that can be analyzed to look at trends to assist in planning for growth and needs.
Prerequisites
- A Linux based VPS with Hostwinds
- ssh access as the root or sudo user in the command line
- A good working backup or snapshot of your Cloud VPS before continuing with this guide
Dependencies
CentOS requires the epel repository to be installed.
# yum -y install epel-release
# yum repolist
Then install vnstat and run it as a persistent service.
# yum -y install vnstat
# systemctl enable vnstat
For Ubuntu/Debian
# apt-get install -y vnstat
# systemctl enable vnstat
Find the interfaces
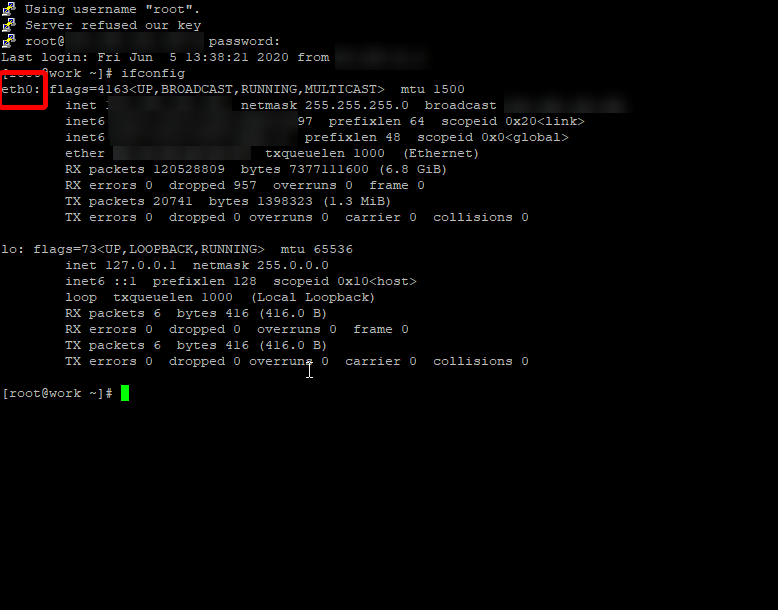
Use ifconfig to find the active interfaces.
# ifconfig
Get vnstat running
Step 1: Create the database and assign permissions
# vnstat -u -i eth0
Repeat for any additional interfaces
**Step 2: ** Change the permission of the database directories
# chown -R vnstat:vnstat /var/lib/vnstat
Step 3: Restart the vnstat service
# systemctl restart vnstat
Step 4: Confirm that vnstat is running
# systemctl status vnstat
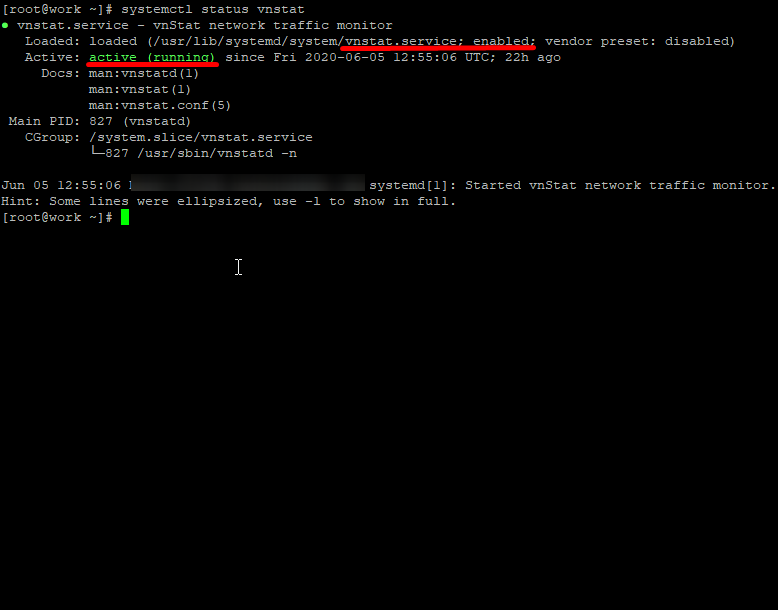
Make sure that it is active and enabled. Any errors will appear below the CGroup lines.
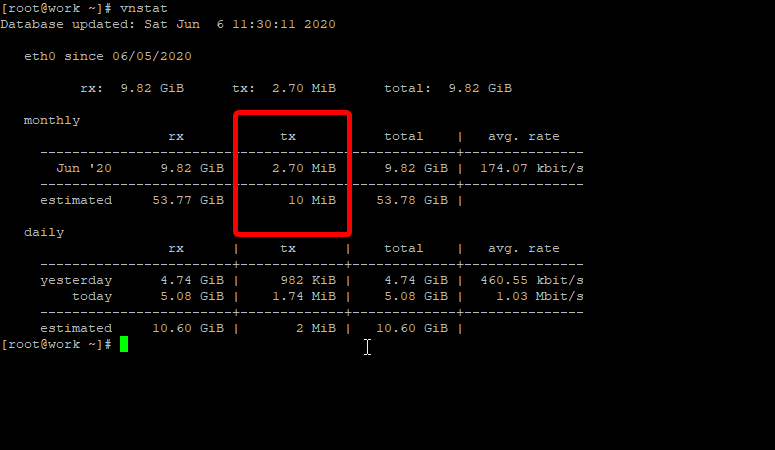
You will have to let vnstat collect data before we can view it, so let it run so you can have some data to analyze.
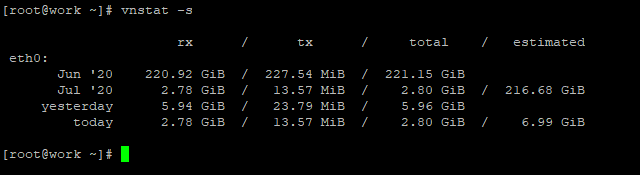
The Summary view allows an easy-to-read layout.
# vnstat -s
The final feature to allow posting to a web status page or prep the summary to be sent to email is to display it in an easy-to-read visual representation. We have installed an Apache web server and created this cronjob to run every 6 hours to facilitate this. This is completed with the simple tool vnstati.
# crontab -e
Our crontab editor happens to be vim or vi -- use the "i" or insert key to type. Then when done editing, press Esc followed by "ZZ" to quit and save; or ":q!" to quit without saving.
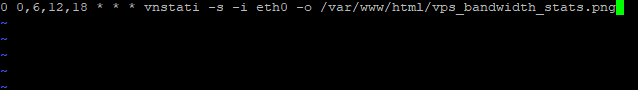
In case you would like the copy/paste for the crontab
0 0,6,12,18 * * * vnstati -s -i eth0 -o /var/www/html/vps_bandwith_stats.png
Then we create a new index.html file in your default Apache server document root like this.
# vi /var/www/html/index.html
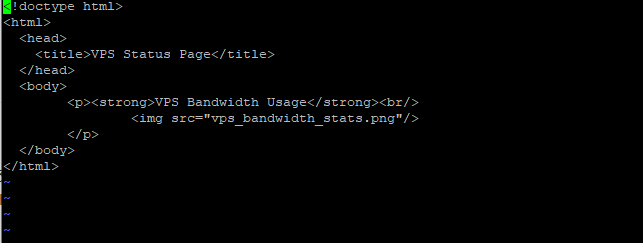
In case you would like to copy/paste the code
<!doctype html>
<html>
  <head>
    <title>VPS Status Page</title>
  </head>
  <body>
        <p><strong>VPS Bandwidth Usage</strong><br/>
                <img src="vps_bandwidth_stats.png"/>
        </p>
  </body>
</html>
Finally, browse to the webserver to view the current status at http://YourVpsIPaddress.
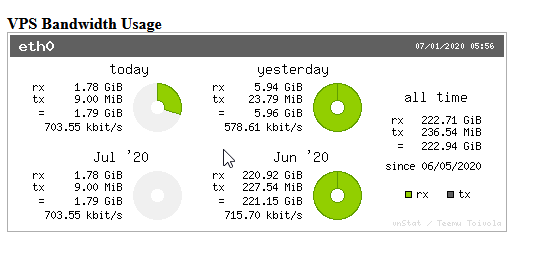
Now you can easily monitor your VPS without having to log in to your Cloud control portal to see instance details.
Written by Hostwinds Team / June 5, 2021