
Hostwinds Tutorials
Search results for:
Table of Contents
Open Source Monitoring Service
Tags: Web Hosting
One of the most important parts of Web Hosting is to make sure that your server is up and running. One of the essential steps is to ensure that you are monitoring the server as often as possible. This may not be possible on your own, but one option would be to use a monitoring service. This guide will show you some Open Source Monitoring Services you can use to track the health of your servers.
Monitoring is an important step for your site health, as well as for server health in general. Once a server begins to have errors, the issue can escalate if left alone. Therefore, monitoring is needed to ensure the health of your sites and servers by detecting issues early so they can be mitigated quickly. You may wish to enable a monitoring service that will allow you to monitor your server to help with scanning for any issues to fix them before they become a problem.
How Does Monitoring Work?
With the monitoring service set, what you get is setting up a service to check your server's connectivity. It does this in multiple aspects, such as checking to ensure that it responds to pings, that the MX records are reading correctly, ensuring connection to your sites via HTTP, and much more.
Different monitoring services may offer different features. Some will be better than others, depending on what you would like to monitor. So keep in mind that not all monitoring systems are equal, and choose what is best for you. You can even utilize more than one if you like what is offered by different services.
Open Source Monitoring Service Options
We will introduce you to six different open source monitoring services in this guide. This will only give an overview, so you will want to review them as well further. The six we will look at are Cacti, Icinga, Nagios, Netdata, OpenNMS, and Zabbix. We will only be covering these six here, but do keep in mind that there are many more options for you to choose from. Ultimately, the choice is entirely up to you for which monitoring service may fit your needs.
Cacti
Cacti, which was first released in 2001, offers network monitoring and graphing of its data. This is displayed in a front-end application that monitors real-time data. It is useful for any network size you would need to monitor, from small Local Area Networks to complex infrastructures.
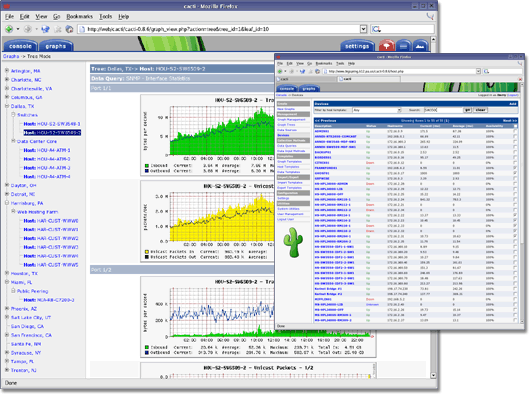
Cacti Screenshot of panel
Nagios
Nagios was founded in 1999 and is one of the biggest leaders in providing network monitoring solutions. Their monitoring solution is widely used between small to enterprise-level infrastructures. Nagios can monitor many aspects of your services, from networking protocols, system metrics, applications, web servers and websites, the Operating System, much more. It has also been optimized to run through a Core 4 monitoring engine, giving a high performance with low resource usage.
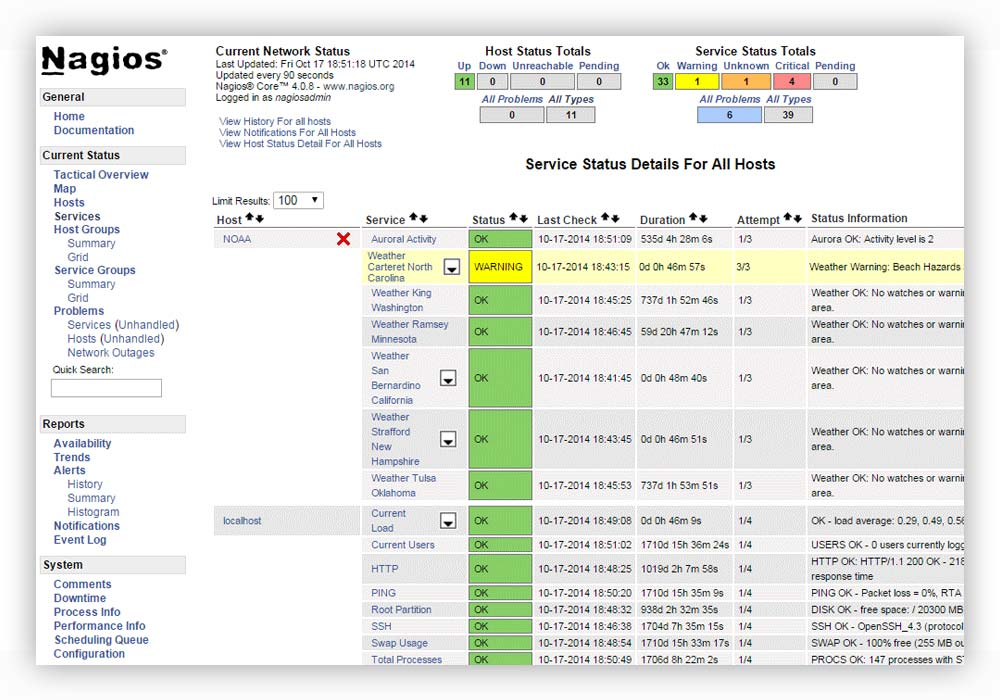
Nagios screenshot of the panel
Icinga
Icinga is a fork made off of Nagios in 2009. It is an open-source network monitoring application. It offers a web-based application to view and monitor the health of your network and all available systems within your network. Icinga originally branched off Nagios to focus more on what they believed needed to be added, such as specific monitoring of databases and add more API functionality.
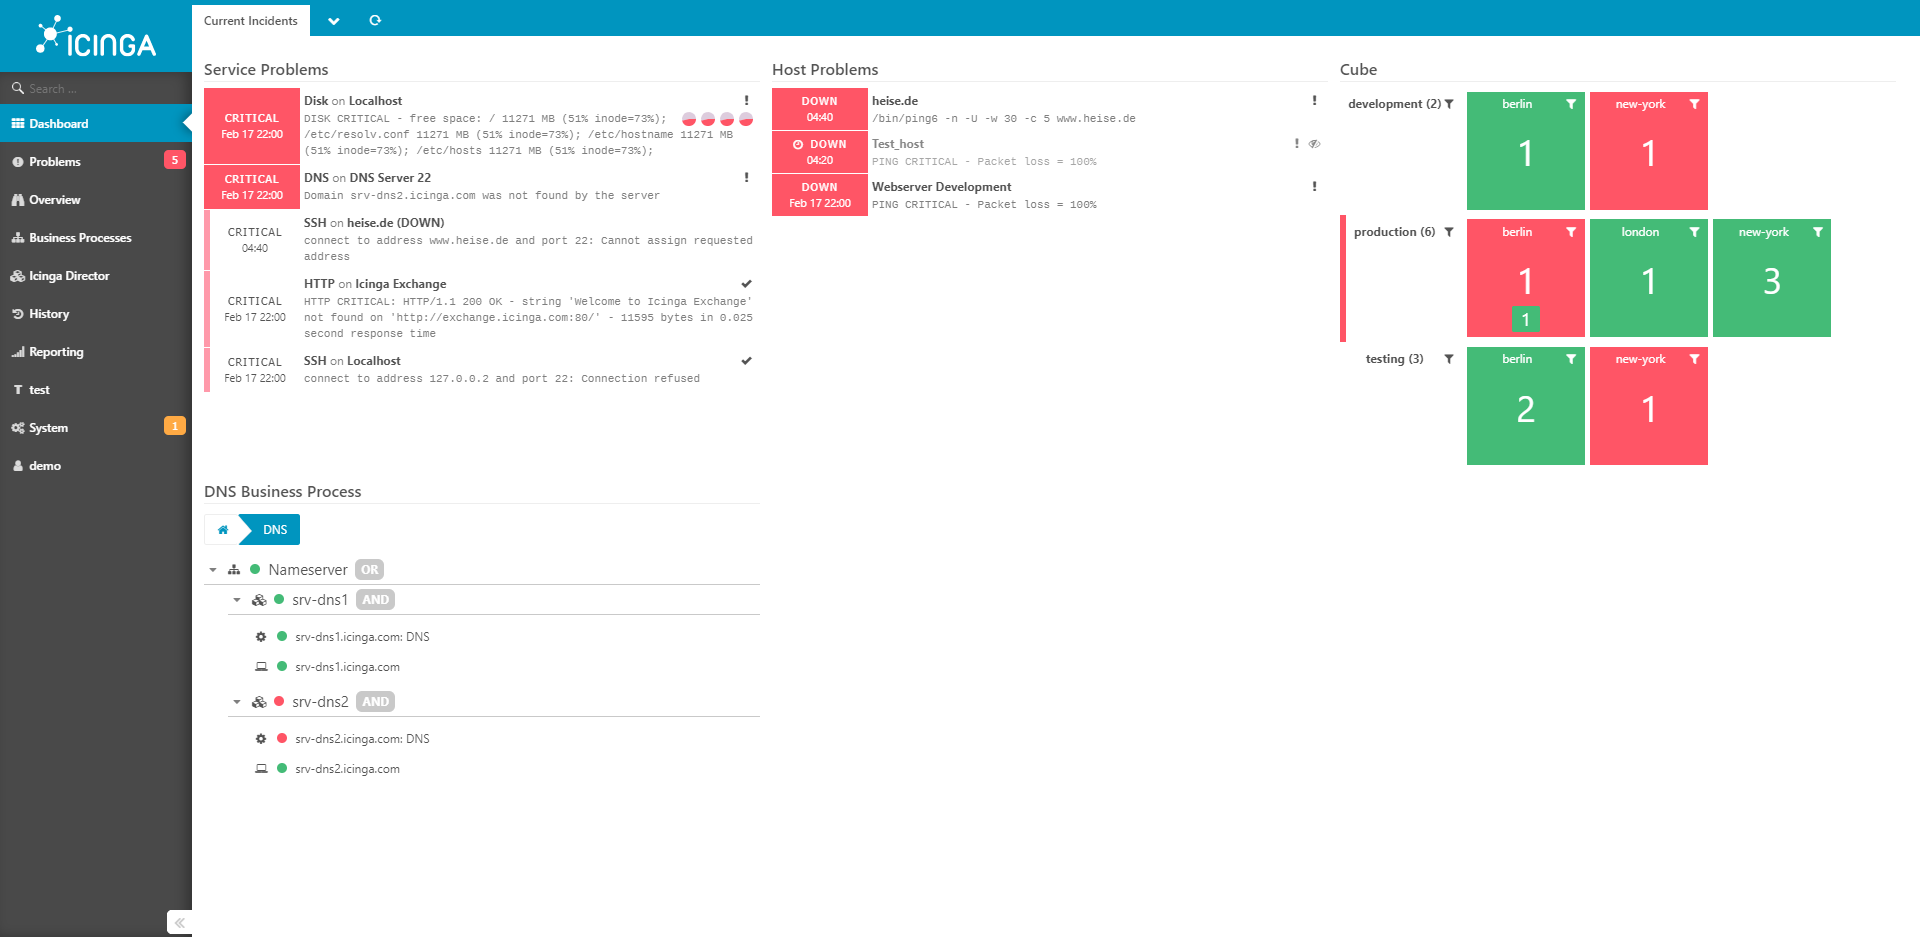
Icinga Demo Screenshot
Netdata
Netdata offers real-time monitoring and performance troubleshooting for your infrastructure, which is unlike all of the rest. It is designed to run on any system and will do so fast and efficiently. Netdata is quick to install and even quicker to show results. It will automatically detect what metrics to show for your server. They offer a more modern take on resource monitoring that also shows more details on its display.
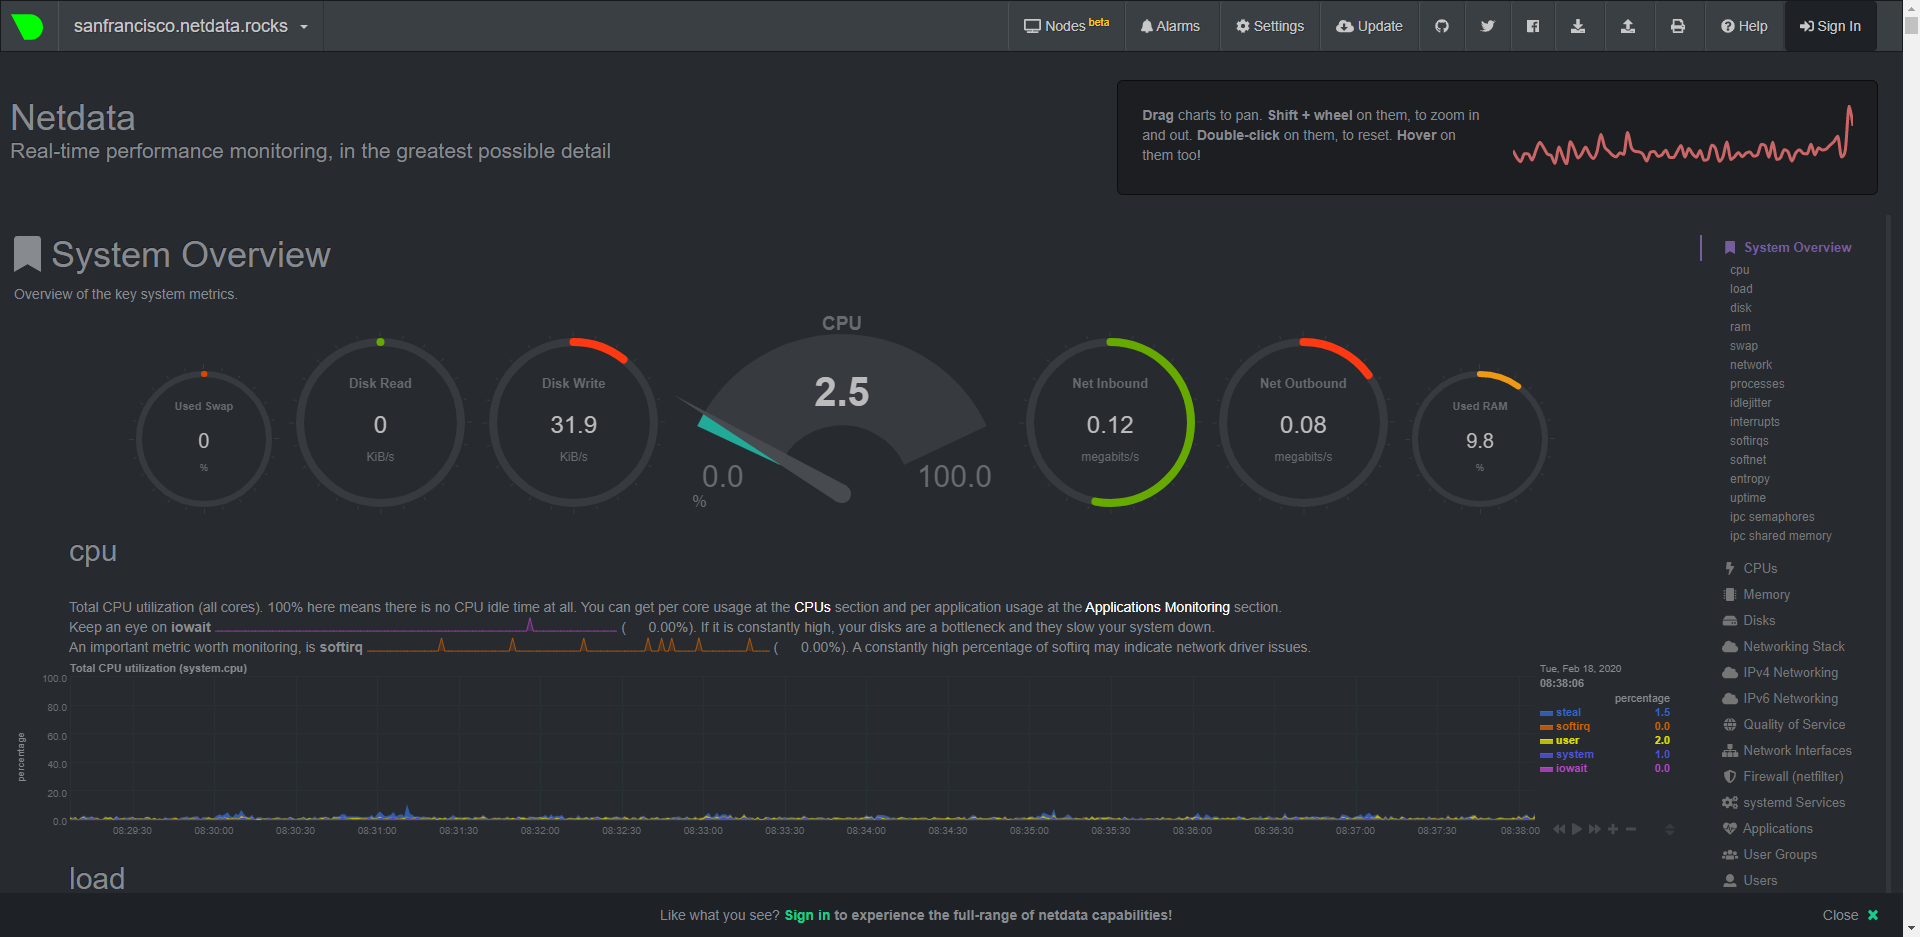
Netdata Demo Screenshot
OpenNMS
OpenNMS allows you to build the monitoring of your network how you would like. It offers you the ability to collect system performance data on JMX, SNMP, HTTP, JSON, XML, NRPE, and much more. You would be customizing the monitoring to what you want to view for your sites and setting up the monitoring for each service. This will allow you to personalize what you would like to keep watch on for your infrastructure.
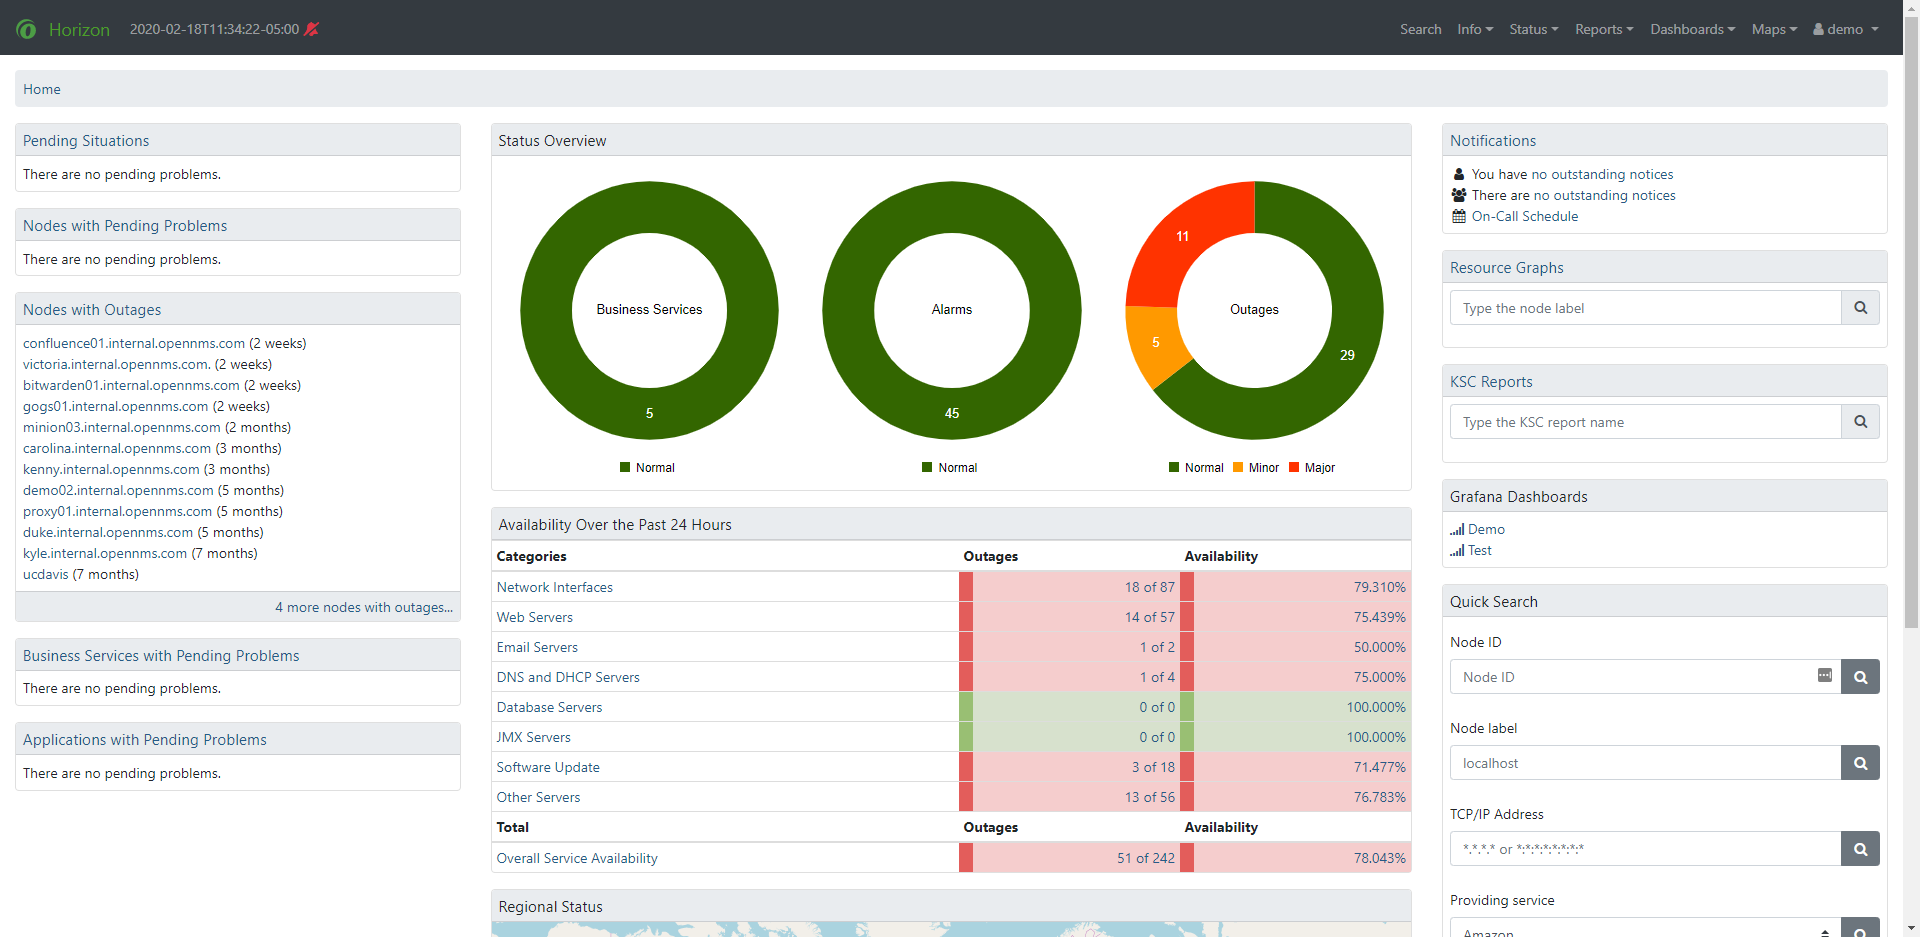
OpenNMS Demo Screenshot
Zabbix
Zabbix is an enterprise-level monitoring service that allows you to monitor everything on your system. Databases and applications on the server, to the hardware and networking of the server. It is very widely used by thousands of companies worldwide, such as DELL and ICANN.
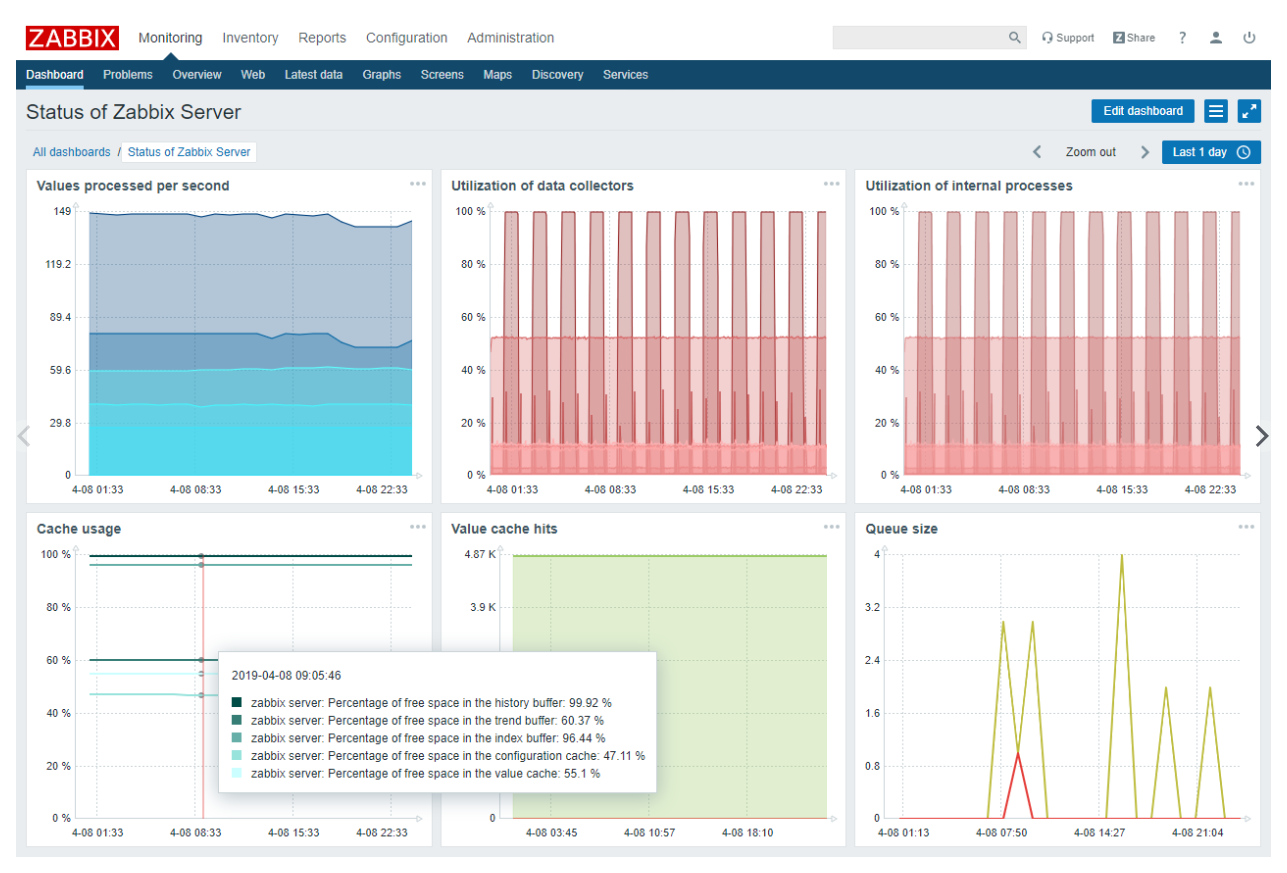
Zabix screenshot from their screenshots page
Other Options
While many large-scale monitoring options are available, you can choose something much smaller and easier to set up. For example, iptraf-ng is a Linux installation. It shows you the current connections and transfer rates, and much more.
Written by Gregory Gilbert / February 19, 2020