
Hostwinds Tutorials
Search results for:
Table of Contents
SHOUTcast Graphical Statistics Overview
Tags: SHOUTcast
When you manage your SHOUTcast station, whether it be for podcasts or music, it is practical to monitor your views to see what is popular on your station. That way, you can properly curate your content to fit your audience based on what you see attracts more visitors. Through your SHOUTcast control panel, this can be tracked with the Graphical Statistics page.
How To Find The Graphical Statistics Page
This guide assumes that you will be using a SHOUTcast service with Hostwinds, which has WHMSonic installed.
- Login to your SHOUTcast control panel.
- There are a couple of ways in the interface that you can enter the Graphical Statistics page. Both of these ways would be done within the SHOUTcast control panel.
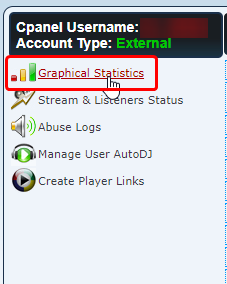
- Suppose you are on the Edit / Update My Radios page. There will be the option listed for Graphical Statistics underneath the cPanel username.
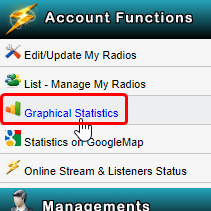
- The other way, which can be done from any page within the SHOUTcast control panel, is in the upper left. This would be in the Account Functions menu, listed as Graphical Statistics.
- Clicking on those buttons will bring you to the Graphical Statistics page, where you can track, visually, your visitors that listen to your SHOUTcast station.
What Does The Graphical Statistics Charts Mean?
With each report or chart inside the Graphical Statistics, you can monitor how many Unique Listeners listen to your SHOUTcast station. Unique Listeners means each Listener that is different. For example, if a single Listener connected 4 or more times in a day, it would only count them as 1 Unique listener. All charts on this page will use L to abbreviate for Listeners as a Unit of measurement.
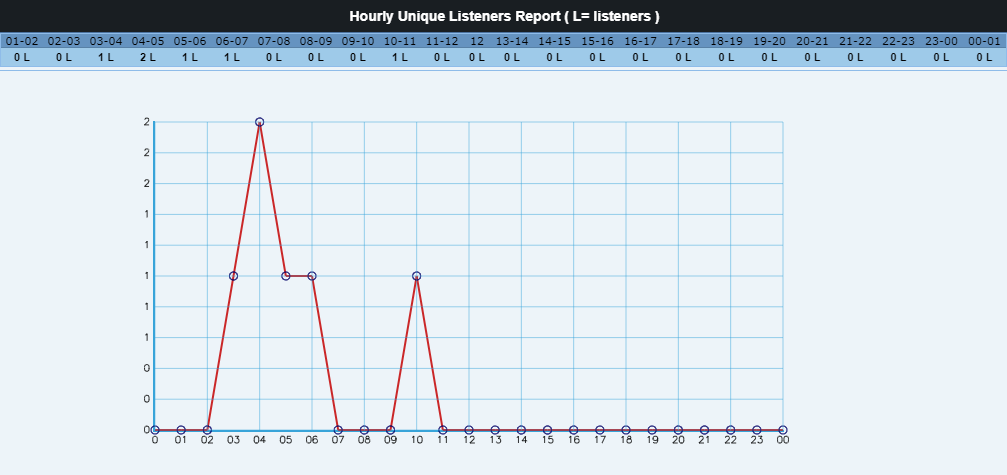
Hourly Unique Listeners Report
This chart will track how many Listeners have been listening per hour in the last day. It may be useful to check this chart after a broadcast or frequently during different times of the day to see when your Listeners are most actively listening. The hourly chart for unique listeners will reset every 24 hours. Here is an example of what this chart may appear to be in your Control Panel.
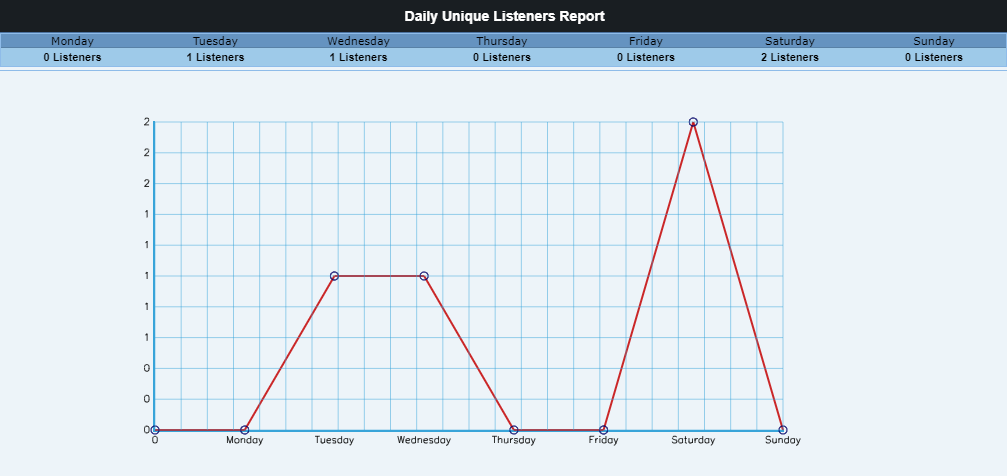
Daily Unique Listeners Report
With the Daily report, you can see on which days your SHOUTcast station receives the most traffic. This can be especially useful if you have themed days or events on certain days of the week. For example, if you host music on your station, you could have different genres of music on each day (Electronic Music on Mondays). This way, you can see which genre appeals to your listeners more. The daily chart will refresh every Sunday according to server time. Here is what an example of this chart can look like.
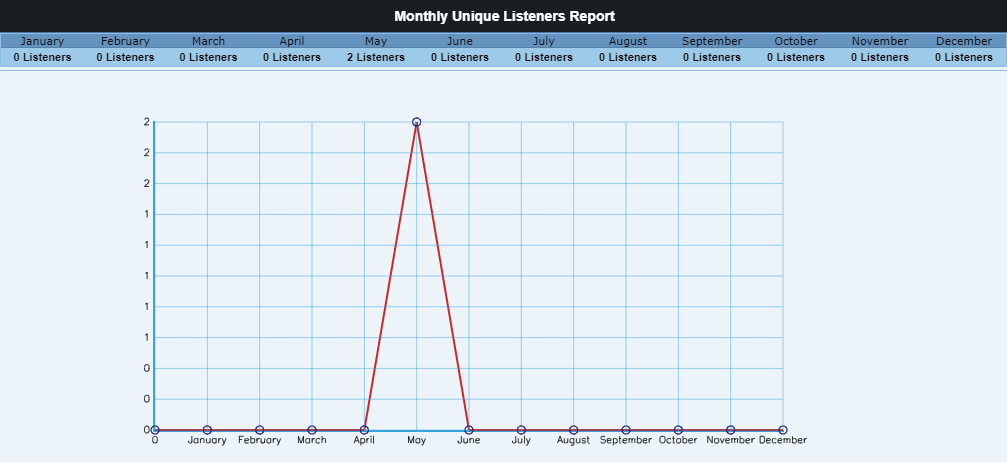
Monthly Unique Listeners Report
Although not as useful as the other Reports, this chart can be used to analyze your monthly traffic to curate your content. This chart will give a broader overlook of how many listeners your SHOUTcast station has. According to server time, this chart will reset on the 31 of December (for the new year). This is what this chart may appear as.
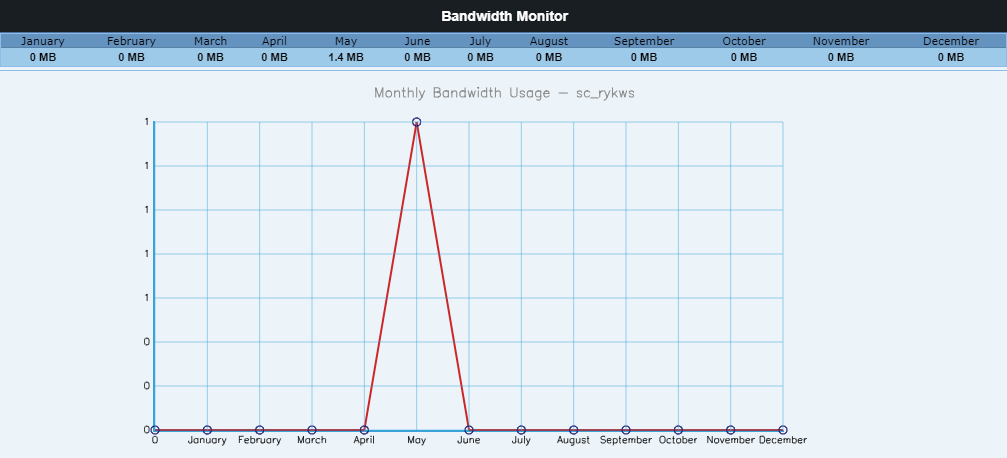
Bandwidth Monitor
This chart is useful if you want to track how much bandwidth your SHOUTcast station is using per month. These are not especially useful on Hostwinds' SHOUTcast Hosting plans as these have Unmetered Traffic / Bandwidth. This can still allow some insight into how much resources your station is consuming. Here is what this may look like for you.
If you should have any questions or would like assistance, please contact us through Live Chat or by submitting a ticket with our Technical Support team.
Written by Hostwinds Team / May 10, 2018