
Hostwinds Tutorials
Search results for:
Table of Contents
Viewing Apache Server Status In WHM
Tags: WHM
In WHM, you can see the current status of Apache and additional information such as when it was last built and when it was last started. This can help if you are not sure the last time that you had updated your Apache web server, as well as to see if the webserver had gone down recently for any reason. In addition to this, you can see the processes that Apache spawns to handle serving web pages to your visitors.
Where To Find Apache Status
Step One: Log into your WHM Administrative Dashboard
Step Two: Once logged in, in the upper left, you can search for Server Status and find Apache Status from the list
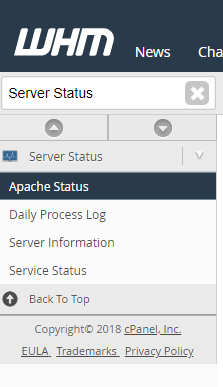
Step Three: Select Apache Status, and you will be brought to a new page that will have more information regarding the Apache webserver
Viewing Apache Information and What It Means
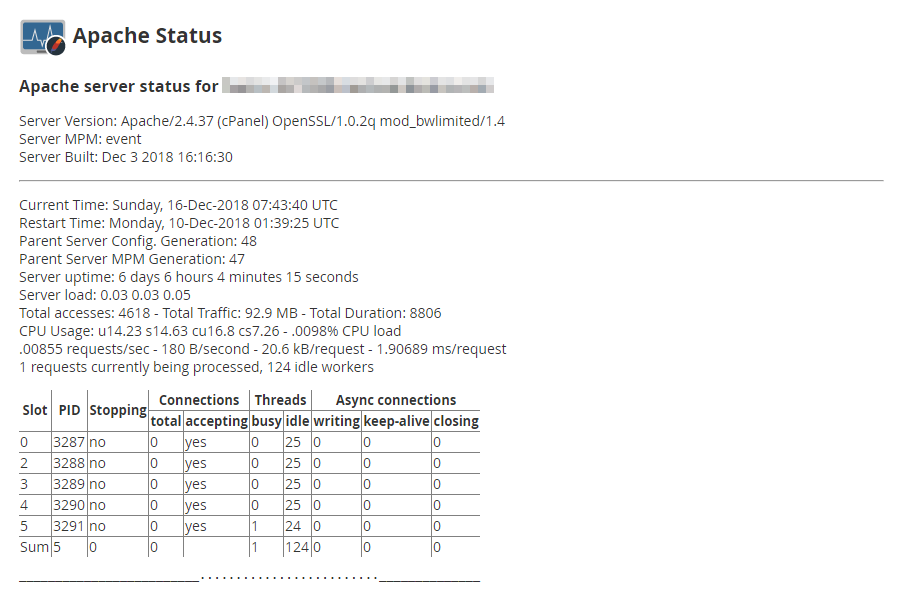
From the Apache Status page, there will be quite a bit of information. At the top, it will list the hostname of the current server that Apache is running on, just in case you have multiple servers. Below that, there is information on how Apache was built. This includes the current Apache server version, the MPM (Multi-Processing Module) being used, as well as the date and server time Apache had been last built.

Underneath, there will be a line to separate the rest of the information about Apache. This is more current information that relates to the resources being used by the webserver. It will show the current server time when the webserver had last been restarted, Server uptime, and CPU Usage. In addition to this, this page will show the amount of traffic that has come through in total (including requests or accesses)
The Apache Status Scoreboard
With the scoreboard, you can view the worker processes that Apache has spawned to handle connections and additional information. The column names may be a little confusing, especially since they are shortened. Here is what this chart may look like:
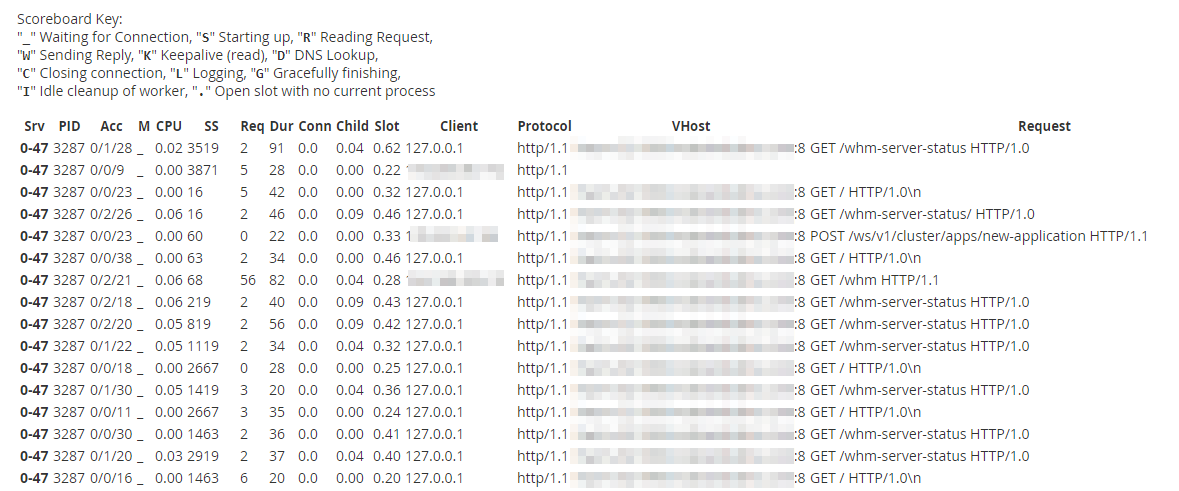
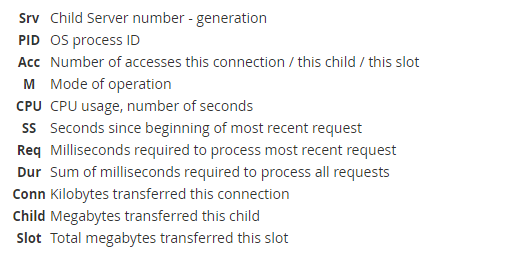
Lower on the page, there will be a key to decipher what each value is in the chart.
This information does not include what the Client, Protocol, VHost, or Request columns mean, but these are as follows:
- Client – This is the IP address of the user or visitor that had requested the information from the webserver.
- Protocol – This is the protocol that the Client used to connect to the server. These will most commonly be the same all the way down.
- VHost – This is the domain name on the server that had been requested or accessed.
- Request – This will be the request that was made from the Client accessing the server.
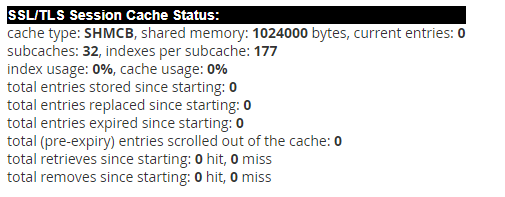
SSL / TLS Session Cache Status
At the bottom of the page, you may notice a small box of information referring to SSL on the server. This refers to caching of keys that are used for Sessions made through Apache with SSL. This way, Apache doesn't have to establish the SSL connection each time. It can reuse the same one as the visitor continues to use the site. This helps to improve speed on the site with SSL Connections.
Written by Hostwinds Team / December 18, 2018