
Hostwinds Tutorials
Search results for:
Table of Contents
Using a ratings plugin with your WordPress site
Tags: Web Site
This tutorial explains how to install a popular WordPress ratings/feedback plugin and analyze the acquired data to help improve your user satisfaction and/or profitability. If you do not have a running WordPress site, consider using our Creating a WordPress site for a small business tutorial to create one.
Choosing a WordPress ratings/feedback plugin
There are numerous choices when it comes to choosing a ratings/feedback plugin for WordPress (WP). Based on customer ratings and feedback, Rate my Post was chosen for this tutorial but feel free to choose whichever plugin you deem most appropriate for your situation. Similarly (because of popularity), the (e-commerce compatible) Astra theme was used.
Installing the Rate my Post plugin
Contrary to the name, the Rate my Post plugin works for web pages (as well as blog posts). The following procedure describes how to install the plugin:
1. Log in to your WP dashboard by navigating to one of the following URLs:
- http://<your domain>/wp-login.php
- http://<your domain>/wp/wp-login.php
- http://<your domain>/wordpress/wp-login.php
2. Select Plugins, then Add New:

3. In the Search plugin... field, type rating. You are presented with a number of available options. Find Rate my Post - WP Rating System and then select Install Now:

When installed, select the Active button. You may then (optionally) wish to enable auto-updates:

4. Select Rate my Post, then Settings: 
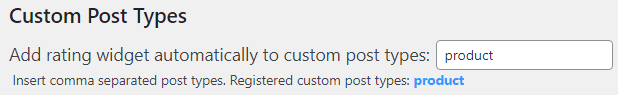
Adjust the settings as appropriate for your situation. Because this article is assuming an e-commerce style site with no blog posts (see the "Removing WP blog components" section of Creating a WordPress site for a small business), we'll only show the rating widget on product pages:
5. Select the Customize tab and adjust the text as necessary. For example:
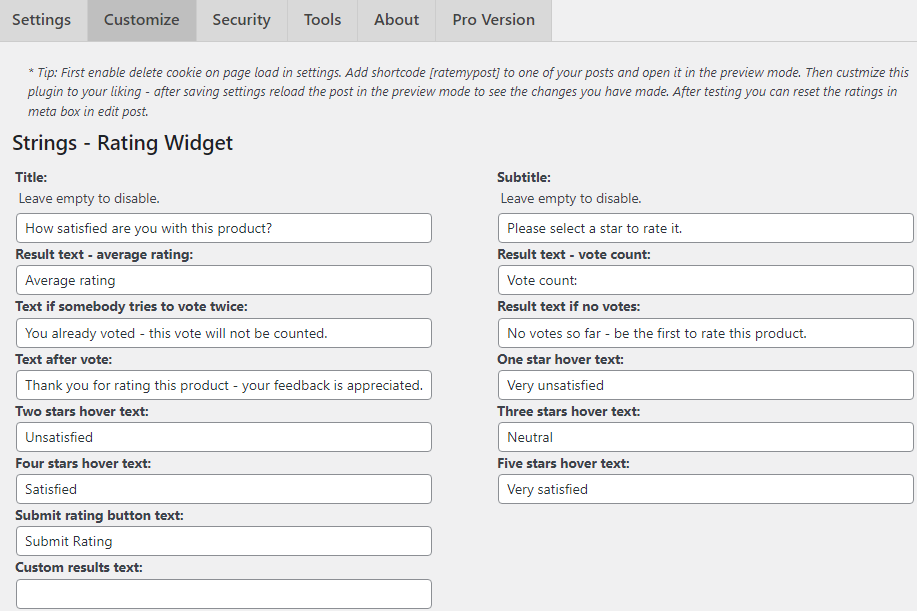
And perhaps:
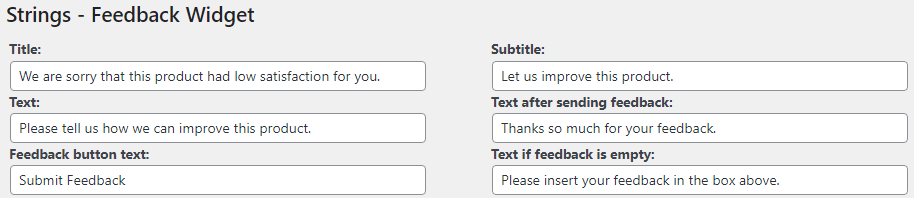
When you're satisfied (no pun intended), select the Save Customize Options button.
6. You should now see, near the bottom of all of your product pages, the following rating widget:
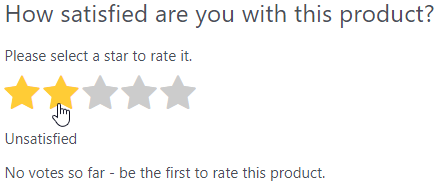
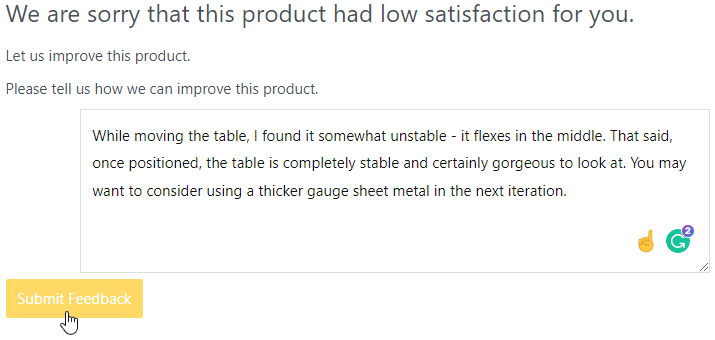
By default, the Rate my Post plugin is set to request feedback if a rating is two stars or less:
We next discuss accessing and analyzing the acquired plugin data.
Rate my Post numeric data
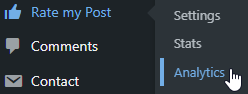
1. To view the detailed star rating data, select Rate my Post, then Analytics:
You should see data similar to the following:
2. Sort by Time and then by Post. This will allow your to make sense of the Average Rating column:
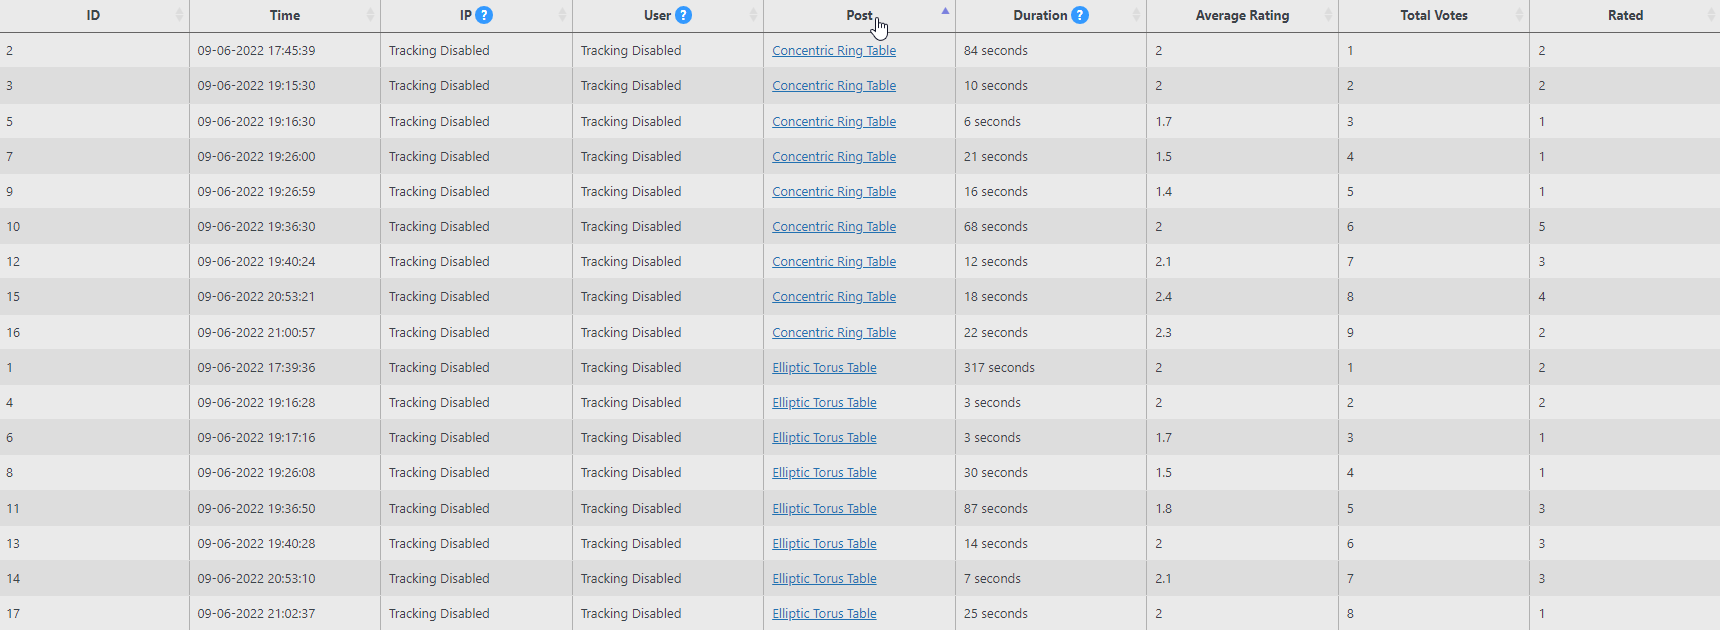
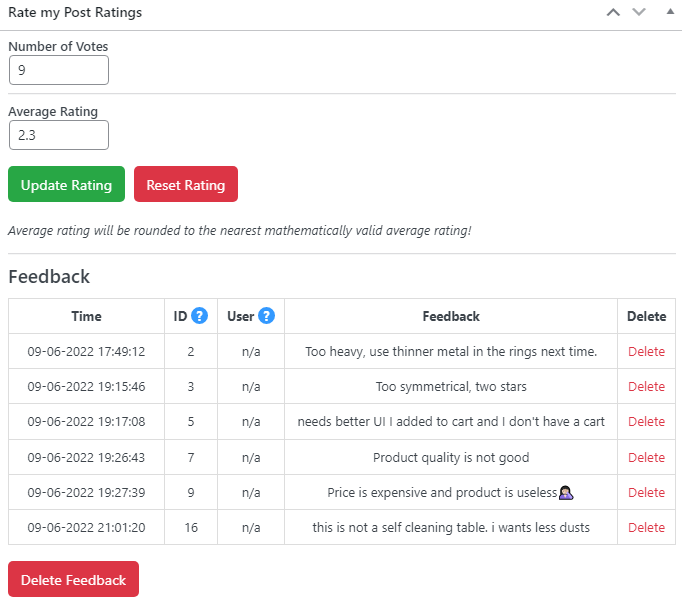
In the table above, we see that "Total Votes" is the total running vote count. Thus, in row four (ID 7), we see that we have 2 two-stars votes and 2 one-star votes, whose average is (2 + 2 + 1 + 1) / 4 = 1.5, as shown. In row nine (ID 16), we see that 9 total votes were cast for the Concentric Ring Table with an average rating of 2.3 (average the associated Rated data, 21 / 9 ≈ 2.3). In the last row (ID 17), we see that 8 total votes were cast for the Elliptic Torus Table with an average rating of 2 (again, average the associated Rated data, 16 / 8 = 2).
These summary statistics can be seen by selecting Rate my Post, and then Stats:

So, if we had to pick a product to improve first, the summary statistics indicate that it should be the Elliptic Torus Table. But what sorts of improvements should be made? This is where textual feedback can come in handy.
Feedback analysis
If the amount of feedback is relatively small, one can manually read through each response to get a sense of actionable themes. However, an alternate approach may be indicated if you have hundreds of responses. There are several possibilities, but one straightforward approach is to use a word cloud to tease out possible themes. A procedure for doing so is presented next.
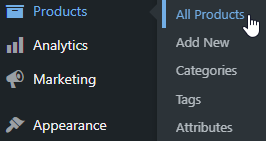
1. From the WP dashboard, select Products, then All Products:
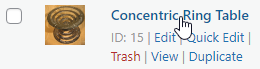
2. Select the product you're interested in, for example:
3. Scroll to the bottom of the product page and note the associated feedback:
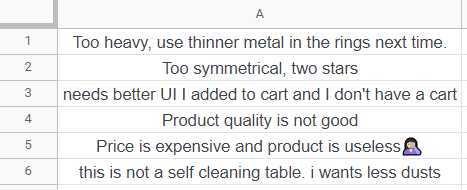
4. Copy the content of the feedback table and paste it into a spreadsheet (or similar tool). Deleted all columns and rows, leaving just the responses:
5. Choose a word cloud tool. Some online possibilities include Free Word Cloud Generator, WordItOut, etc. Next, copy and paste the feedback into the word cloud tool and note the results:
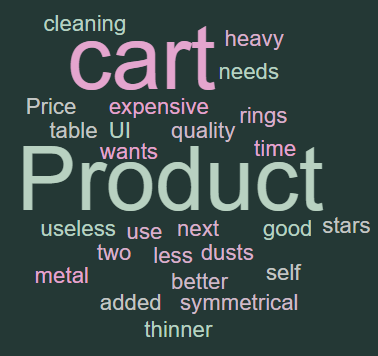
Ignoring the red herring "Product", one word does clearly pop out: "cart". This result may indicate that the website's cart system should be investigated. Given the extremely small dataset, the above results are purely for demonstrative purposes only. However, as the size of one's dataset increases, so does the veracity (in general) of the results, as discussed next.
Data analysis
To provide realistic examples, we'll work with a relatively large dataset of Amazon shoe rating data (n = 6.8K).
Mean and standard deviation
The first thing to discuss is the average (mean x̄) and standard deviation (s) with respect to a 5-star rating scheme. The distribution (histogram) of the Amazon shoe data follows:
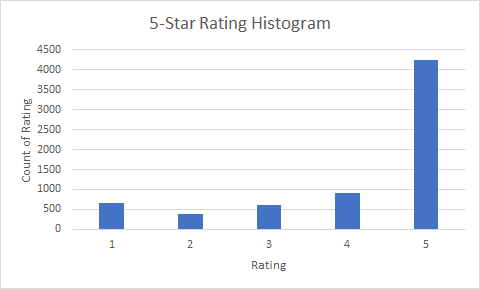
The data has a mean of x̄ = 4.13 and a standard deviation of s = 1.34. This implies that at least 95% of all ratings fall within two standard deviations of the mean. That is, between 4.13 - 2·1.34 and 4.13 + 2·1.34, or 1.5 and 6.8. Since 6.8 is an impossibility, we could say with greater confidence that at least 95% of all ratings fall between 1.5 and 5. However, these results are entirely predicated on the assumption that the data is normally distributed, which is clearly not the case. A normal distribution for the above data would look similar to:
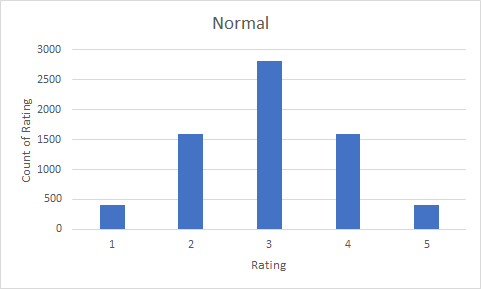
Because the 5-star rating data is not normally distributed, we must narrow the above (x̄ ± 2s) 95% confidence interval. One method to do so is to use Chebyshev's theorem, which states, for a broad class of probability distributions, that at least 75% of all data falls within two standard deviations of the mean. So, we can confidently say that at least 75% of all ratings will fall between 1.5 and 5.
Note that the average (mean) rating statistic (4.13) is valid and the same for both approaches.
Per product ratings
For a site with many products, the Rate my Post summary table would have numerous rows providing the mean product rating (as opposed to the two rows shown here):

You can copy and paste this data directly into a spreadsheet. From there, you can compare products with 30 or more votes (n ≥ 30 being a statistical rule of thumb). For the shoe data, such a procedure produces:
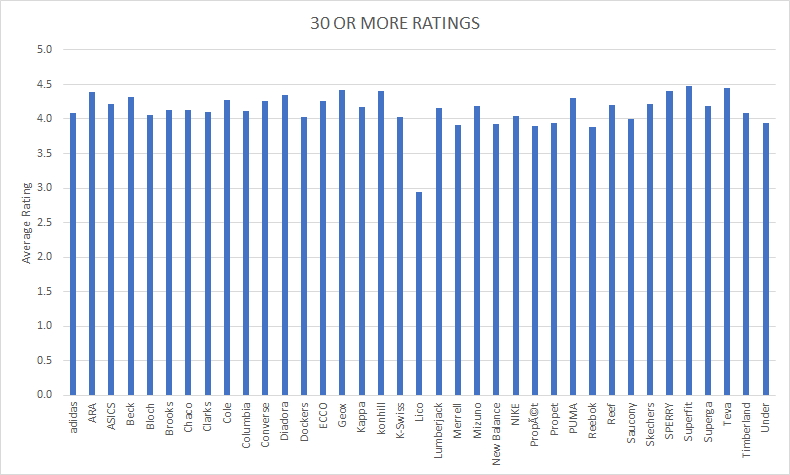
With one exception, we see that the average rating is relatively constant (nearly all around 4). Since a vote is roughly equivalent to a sale, we can create the following chart from a sufficiently large Rate my Post summary table:
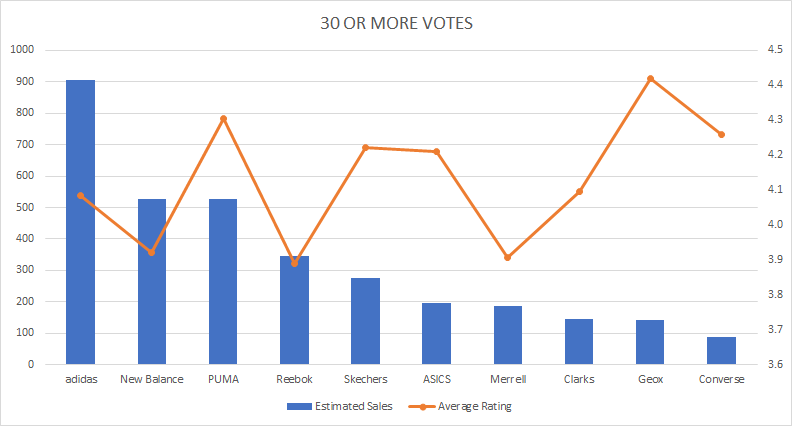
Interestingly, there appears to be little correlation between estimated sales and ratings in this case.
Another possibility might be plotting product page views (via the WP-Statistics plugin or similar) against product ratings:
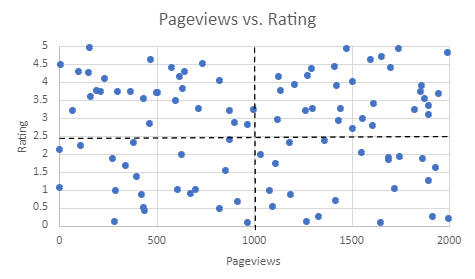
In the above chart, each blue dot represents a particular product page. The vertical dashed line represents the average number of product page views. The horizontal dashed line represents the overall average rating for all products. This breaks the chart into four quadrants. The product pages with high page views and low ratings (bottom right corner) may merit some investigation (particularly the three product pages in the far bottom right of the quadrant).
Clearly, there are many possibilities when it comes to the analysis of website-related data, but the above should get you started in obtaining the essential metrics of your WordPress e-commerce site.
Written by Karlito Bonnevie / June 8, 2022